Page 1307 - Clinical Immunology_ Principles and Practice ( PDFDrive )
P. 1307

CHaPter 93  Assessment of Functional Immune Responses in Lymphocytes                    1269


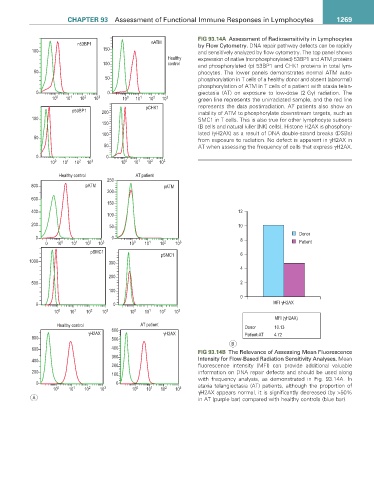
                                                                  FIG 93.14a  Assessment of Radiosensitivity in Lymphocytes
                          Q  %3                   Q$70            by Flow Cytometry. DNA repair pathway defects can be rapidly
                                                                  and sensitively analyzed by flow cytometry. The top panel shows
                                                        +HDOWK\   expression of native (nonphosphorylated) 53BP1 and ATM proteins
                                                        FRQWURO   and phosphorylated (p) 53BP1 and CHK1 proteins in total lym-
                                                                  phocytes. The lower panels demonstrates normal ATM auto-
                                                                  phosphorylation in T cells of a healthy donor and absent (abnormal)
                                                                  phosphorylation of ATM in T cells of a patient with ataxia telan-
                                                                  giectasia (AT) on exposure to low-dose (2 Gy) radiation. The
                                                                  green line represents the unirradiated sample, and the red line
                                                 S&+.             represents the data postirradiation. AT patients also show an
                         S  %3                                    inability of ATM to phosphorylate downstream targets, such as
                                                                  SMC1 in T cells. This is also true for other lymphocyte subsets

                                                                  (B cells and natural killer [NK] cells). Histone H2AX is phosphory-
                                                                  lated (γH2AX) as a result of DNA double-strand breaks (DSBs)
                                                                  from exposure to radiation. No defect is apparent in γH2AX in
                                                                  AT when assessing the frequency of cells that express γH2AX.


                    +HDOWK\ FRQWURO          $7 SDWLHQW

                             S$70                      S$70


                                                                                                   'RQRU

                                                                                                   3DWLHQW
                               S60&
                                                      S60&


                                                                                          0), γ+ $;

                                                                                           0),  γ+ $;
                    +HDOWK\ FRQWURO            $7 SDWLHQW                        'RQRU
                              γ+ $;                   γ+ $;                      3DWLHQW $7

                                                                             %
                                                                  FIG 93.14B  The Relevance of Assessing Mean Fluorescence

                                                                  Intensity for Flow-Based Radiation Sensitivity Analyses. Mean
                                                                  fluorescence intensity (MFI) can provide additional valuable
                                                                  information on DNA repair defects and should be used along
                                                                  with frequency analysis, as demonstrated in Fig. 93.14A. In
                                                                  ataxia telangiectasia (AT) patients, although the proportion of

                                                                  γH2AX appears normal, it is significantly decreased (by >50%
            $                                                     in AT (purple bar) compared with healthy controls (blue bar).
   1302   1303   1304   1305   1306   1307   1308   1309   1310   1311   1312