
Page 1302 - Clinical Immunology_ Principles and Practice ( PDFDrive )
P. 1302
1264 Part eleven Diagnostic Immunology
&'
66& &RXQW &RXQW &HOO WUDFNHU &HOO WUDFNHU &RXQW
± ±
)6& &' $3& &79 $$'
6SRQWDQHRXV FRQWURO 0D[LPXP UHOHDVH FRQWURO
&RXQW &RXQW
± ±
$$' $$'
$
&RXQW &RXQW &RXQW &RXQW
± ± ± ±
$$' $$' $$' $$'
6SRQWDQHRXV 1.&
&RXQW &RXQW
± ±
$$' $$'
%
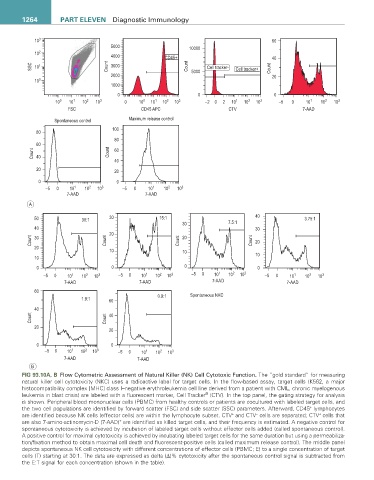
FIG 93.10a, B Flow Cytometric Assessment of Natural Killer (NK) Cell Cytotoxic Function. The “gold standard” for measuring
natural killer cell cytotoxicity (NKC) uses a radioactive label for target cells. In the flow-based assay, target cells (K562, a major
histocompatibility complex [MHC] class I–negative erythroleukemia cell line derived from a patient with CML, chronic myelogenous
®
leukemia in blast crisis) are labeled with a fluorescent marker, Cell Tracker (CTV). In the top panel, the gating strategy for analysis
is shown. Peripheral blood mononuclear cells (PBMC) from healthy controls or patients are cocultured with labeled target cells, and
+
the two cell populations are identified by forward scatter (FSC) and side scatter (SSC) parameters. Afterward, CD45 lymphocytes
+
−
+
are identified because NK cells (effector cells) are within the lymphocyte subset. CTV and CTV cells are separated; CTV cells that
+
are also 7-amino-actinomycin-D (7-AAD) are identified as killed target cells, and their frequency is estimated. A negative control for
spontaneous cytotoxicity is achieved by incubation of labeled target cells without effector cells added (called spontaneous control).
A positive control for maximal cytotoxicity is achieved by incubating labeled target cells for the same duration but using a permeabiliza-
tion/fixation method to obtain maximal cell death and fluorescent-positive cells (called maximum release control). The middle panel
depicts spontaneous NK cell cytotoxicity with different concentrations of effector cells (PBMC; E) to a single concentration of target
cells (T) starting at 30:1. The data are expressed as delta (Δ)% cytotoxicity after the spontaneous control signal is subtracted from
the E:T signal for each concentration (shown in the table).