
Page 1314 - Clinical Immunology_ Principles and Practice ( PDFDrive )
P. 1314
1276 Part ElEvEn Diagnostic Immunology
150
NL LAD Control
PMA-treated
100
% Adherent cells 50
0
Plastic Serum- Fibrinogen- Plastic Serum- Fibrinogen-
coated plastic coated plastic coated plastic coated plastic
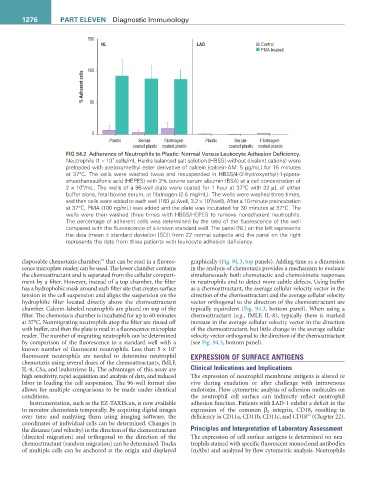
FIG 94.2 Adherence of Neutrophils to Plastic: Normal Versus Leukocyte Adhesion Deficiency.
7
Neutrophils (1 × 10 cells/mL Hanks balanced salt solution [HBSS] without divalent cations) were
preloaded with acetoxymethyl ester derivative of calcein (calcein-AM: 5 µg/mL) for 15 minutes
at 37°C. The cells were washed twice and resuspended in HBSS/4-(2-hydroxyethyl)-1-pipera-
zineethanesulfonic acid (HEPES) with 2% bovine serum albumin (BSA) at a cell concentration of
6
2 × 10 /mL. The wells of a 96-well plate were coated for 1 hour at 37°C with 32 µL of either
buffer alone, fetal bovine serum, or fibrinogen (2.5 mg/mL). The wells were washed three times,
5
and then cells were added to each well (160 µL/well, 3.2 × 10 /well). After a 10-minute preincubation
at 37°C, PMA (100 ng/mL) was added and the plate was incubated for 30 minutes at 37°C. The
wells were then washed three times with HBSS/HEPES to remove nonadherent neutrophils.
The percentage of adherent cells was determined by the ratio of the fluorescence of the well
compared with the fluorescence of a known standard well. The panel (NL) on the left represents
the data (mean ± standard deviation [SD]) from 22 normal subjects and the panel on the right
represents the data from three patients with leukocyte adhesion deficiency.
22
disposable chemotaxis chamber, that can be read in a fluores- graphically (Fig. 94.3, top panels). Adding time as a dimension
cence microplate reader, can be used. The lower chamber contains in the analysis of chemotaxis provides a mechanism to evaluate
the chemoattractant and is separated from the cellular compart- simultaneously both chemotactic and chemokinetic responses
ment by a filter. However, instead of a top chamber, the filter in neutrophils and to detect more subtle defects. Using buffer
has a hydrophobic mask around each filter site that creates surface as a chemoattractant, the average cellular velocity vector in the
tension in the cell suspension and aligns the suspension on the direction of the chemoattractant and the average cellular velocity
hydrophilic filter located directly above the chemoattractant vector orthogonal to the direction of the chemoattractant are
chamber. Calcein-labeled neutrophils are placed on top of the typically equivalent (Fig. 94.3, bottom panel). When using a
filter. The chemotaxis chamber is incubated for up to 60 minutes chemoattractant (e.g., fMLF, IL-8), typically there is marked
at 37°C. Nonmigrating neutrophils atop the filter are rinsed off increase in the average cellular velocity vector in the direction
with buffer, and then the plate is read in a fluorescence microplate of the chemoattractant, but little change in the average cellular
reader. The number of migrating neutrophils can be determined velocity vector orthogonal to the direction of the chemoattractant
by comparison of the fluorescence to a standard well with a (see Fig. 94.3, bottom panel).
6
known number of fluorescent neutrophils. Less than 5 × 10
fluorescent neutrophils are needed to determine neutrophil EXPRESSION OF SURFACE ANTIGENS
chemotaxis using several doses of the chemoattractants, fMLF,
IL-8, C5a, and leukotriene B 4 . The advantages of this assay are Clinical Indications and Implications
high sensitivity, rapid acquisition and analysis of data, and reduced The expression of neutrophil membrane antigens is altered in
labor in loading the cell suspension. The 96-well format also vivo during exudation or after challenge with intravenous
allows for multiple comparisons to be made under identical endotoxin. Flow cytometric analysis of adhesion molecules on
conditions. the neutrophil cell surface can indirectly reflect neutrophil
Instrumentation, such as the EZ-TAXIScan, is now available adhesion function. Patients with LAD-1 exhibit a deficit in the
to monitor chemotaxis temporally. By acquiring digital images expression of the common β 2 integrin, CD18, resulting in
23
over time and analyzing them using imaging software, the deficiency in CD11a, CD11b, CD11c, and CD18 (Chapter 22).
coordinates of individual cells can be determined. Changes in
the distance (and velocity) in the direction of the chemoattractant Principles and Interpretation of Laboratory Assessment
(directed migration) and orthogonal to the direction of the The expression of cell surface antigens is determined on neu-
chemoattractant (random migration) can be determined. Tracks trophils stained with specific fluorescent monoclonal antibodies
of multiple cells can be anchored at the origin and displayed (mAbs) and analyzed by flow cytometric analysis. Neutrophils