
Page 1357 - Clinical Immunology_ Principles and Practice ( PDFDrive )
P. 1357
1318 APPENDIX 2 Laboratory Reference Values
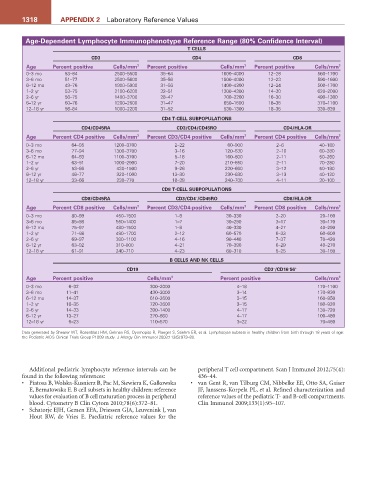
Age-Dependent Lymphocyte Immunophenotype Reference Range (80% Confidence Interval)
T CELLS
CD3 CD4 CD8
Age Percent positive Cells/mm 3 Percent positive Cells/mm 3 Percent positive Cells/mm 3
0–3 mo 53–84 2500–5500 35–64 1600–4000 12–28 560–1700
3–6 mo 51–77 2500–5600 35–56 1800–4000 12–23 590–1600
6–12 mo 49–76 1900–5900 31–56 1400–4300 12–24 500–1700
1–2 yr 53–75 2100–6200 32–51 1300–4300 14–30 620–2000
2–6 yr 56–75 1400–3700 28–47 700–2200 16–30 490–1300
6–12 yr 60–76 1200–2600 31–47 650–1500 18–35 370–1100
12–18 yr 56–84 1000–2200 31–52 530–1300 18–35 330–920
CD4 T-CELL SUBPOPULATIONS
CD4/CD45RA CD3/CD4/CD45RO CD4/HLA-DR
Age Percent CD4 positive Cells/mm 3 Percent CD3/CD4 positive Cells/mm 3 Percent CD4 positive Cells/mm 3
0–3 mo 64–95 1200–3700 2–22 60–900 2–6 40–180
3–6 mo 77–94 1300–3700 3–16 120–630 2–10 60–280
6–12 mo 64–93 1100–3700 5–18 160–800 2–11 50–260
1–2 yr 63–91 1000–2900 7–20 210–850 2–11 70–280
2–6 yr 53–86 430–1500 9–26 220–660 3–12 50–180
6–12 yr 46–77 320–1000 13–30 230–630 3–13 40–120
12–18 yr 33–66 230–770 18–38 240–700 4–11 30–100
CD8 T-CELL SUBPOPULATIONS
CD8/CD45RA CD3/CD4 /CD45RO CD8/HLA-DR
−
Age Percent CD8 positive Cells/mm 3 Percent CD3/CD4-positive Cells/mm 3 Percent CD8 positive Cells/mm 3
0–3 mo 80–99 450–1500 1–9 30–330 2–20 20–160
3–6 mo 85–98 550–1400 1–7 30–290 3–17 30–170
6–12 mo 75–97 480–1500 1–8 40–330 4–27 40–290
1–2 yr 71–98 490–1700 2–12 60–570 6–33 60–600
2–6 yr 69–97 380–1100 4–16 90–440 7–37 70–420
6–12 yr 63–92 310–900 4–21 70–390 6–29 40–270
12–18 yr 61–91 240–710 4–23 60–310 5–25 30–180
B CELLS AND NK CELLS
−
−
CD19 CD3 /CD16 56 +
Age Percent positive Cells/mm 3 Percent positive Cells/mm 3
0–3 mo 6–32 300–2000 4–18 170–1100
3–6 mo 11–41 430–3000 3–14 170–830
6–12 mo 14–37 610–2600 3–15 160–950
1–2 yr 16–35 720–2600 3–15 180–920
2–6 yr 14–33 390–1400 4–17 130–720
6–12 yr 13–27 270–860 4–17 100–480
12–18 yr 6–23 110–570 3–22 70–480
Data generated by Shearer WT, Rosenblatt HM, Gelman RS, Oyomopito R, Plaeger S, Stiehm ER, et al. Lymphocyte subsets in healthy children from birth through 18 years of age:
the Pediatric AIDS Clinical Trials Group P1009 study. J Allergy Clin Immunol 2003;112(5):973–80.
Additional pediatric lymphocyte reference intervals can be peripheral T cell compartment. Scan J Immunol 2012;75(4):
found in the following references: 436–44.
• Piatosa B, Wolska-Kusnierz B, Pac M, Siewiera K, Gałkowska • van Gent R, van Tilburg CM, Nibbelke EE, Otto SA, Gaiser
E, Bernatowska E. B cell subsets in healthy children: reference JF, Janssens-Korpela PL, et al. Refined characterization and
values for evaluation of B cell maturation process in peripheral reference values of the pediatric T- and B-cell compartments.
blood. Cytometry B Clin Cytom 2010;78(6):372–81. Clin Immunol 2009;133(1):95–107.
• Schatorje EJH, Gemen EFA, Driessen GJA, Leuvenink J, van
Hout RW, de Vries E. Paediatric reference values for the