
Page 1356 - Clinical Immunology_ Principles and Practice ( PDFDrive )
P. 1356
2
APPENDIX
Laboratory Reference Values
Thomas A. Fleisher
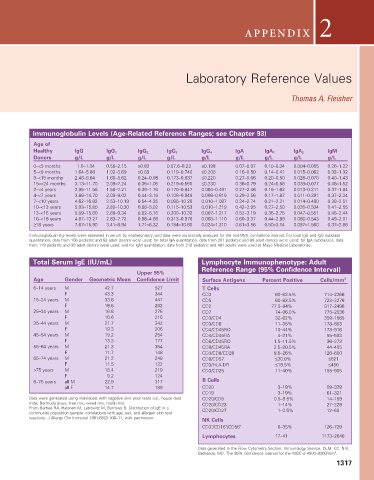
Immunoglobulin Levels (Age-Related Reference Ranges; see Chapter 93)
Age of
Healthy IgG IgG 1 IgG 2 IgG 3 IgG 4 IgA IgA 1 IgA 2 IgM
Donors g/L g/L g/L g/L g/L g/L g/L g/L g/L
0–<5 months 1.0–1.34 0.56–2.15 ≤0.82 0.07.6–8.23 ≤0.198 0.07–0.37 0.10–0.34 0.004–0.055 0.26–1.22
5–<9 months 1.64–5.88 1.02–3.69 ≤0.89 0.119–0.740 ≤0.208 0.16–0.50 0.14–0.41 0.015–0.062 0.32–1.32
9–<15 months 2.46–9.04 1.60–5.62 0.24–0.98 0.173–0.637 ≤0.220 0.27–0.66 0.20–0.50 0.028–0.070 0.40–1.43
15–<24 months 3.13–11.70 2.09–7.24 0.35–1.05 0.219–0.550 ≤0.230 0.36–0.79 0.24–0.58 0.039–0.077 0.46–1.52
2–<4 years 2.95–11.56 1.58–7.21 0.39–1.76 0.170–0.847 0.004–0.491 0.27–2.46 0.16–1.62 0.013–0.311 0.37–1.84
4–<7 years 3.86–14.70 2.09–9.02 0.44–3.16 0.108–0.949 0.008–0.819 0.29–2.56 0.17–1.87 0.011–0.391 0.37–2.24
7–<10 years 4.62–16.82 2.53–10.19 0.54–4.35 0.085–10.26 0.010–1.087 0.34–2.74 0.21–2.21 0.014–0.480 0.38–2.51
10–<13 years 5.03–15.80 2.80–10.30 0.66–5.02 0.115–10.53 0.010–1.219 0.42–2.95 0.27–2.50 0.026–0.534 0.41–2.55
13–<16 years 5.09–15.80 2.89–9.34 0.82–5.16 0.200–10.32 0.007–1.217 0.52–3.19 0.36–2.75 0.047–0.551 0.45–2.44
16–<18 years 4.87–13.27 2.83–7.72 0.98–4.86 0.313–0.976 0.003–1.110 0.60–3.37 0.44–2.89 0.066–0.543 0.49–2.01
≥18 years 7.67–15.90 3.41–8.94 1.71–6.32 0.184–10.60 0.024–1.210 0.61–3.56 0.50–3.14 0.097–1.560 0.37–2.86
Immunoglobulin (Ig) levels were assessed in serum by nephelometry, and data were statistically analyzed for the mid-95% confidence interval. For total IgG and IgG subclass
quantitation, data from 156 pediatric and 92 adult donors were used; for total IgA quantitation, data from 201 pediatric and 99 adult donors were used; for IgA subclasses, data
from 119 pediatric and 99 adult donors were used; and for IgM quantitation, data from 212 pediatric and 401 adults were used at Mayo Medical Laboratories.
Total Serum IgE (IU/mL) Lymphocyte Immunophenotype: Adult
Reference Range (95% Confidence Interval)
Upper 95%
Age Gender Geometric Mean Confidence Limit Surface Antigens Percent Positive Cells/mm 3
6–14 years M 42.7 527 T Cells
F 43.3 344 CD3 60–83.5% 714–2266
15–24 years M 33.6 447 CD5 60–83.5% 723–2276
F 18.6 262 CD2 77.5–94% 817–2496
25–34 years M 16.8 275 CD7 74–96.0% 775–2536
F 16.6 216 CD3/CD4 32–62% 359–1565
35–44 years M 21.7 242 CD3/CD8 11–35% 178–853
F 19.3 206 CD4/CD45RO 10–44% 173–916
45–54 years M 19.2 254 CD4/CD45RA 4–21% 55–593
F 13.3 177 CD8/CD45RO 1.5–11.5% 36–273
55–64 years M 21.3 354 CD8/CD45RA 2.5–20.5% 44–405
F 11.7 148 CD3/CD8/CD28 9.5–26% 126–600
65–74 years M 21.2 248 CD8/CD57 ≤30.0% ≤521
F 11.5 122 CD3/HLA-DR ≤19.5% ≤450
>75 years M 18.4 219 CD3/CD25 11–40% 155–905
F 9.2 124
6–75 years all M 22.9 317 B Cells
all F 14.7 189 CD20 3–19% 59–329
CD19 3–19% 61–321
Data were generated using individuals with negative skin prick tests (i.e., house dust CD20/CD5 0.5–9.5% 14–159
mite, Bermuda grass, tree mix, weed mix, mold mix). CD20/CD23 1–14% 27–229
From Barbee RA, Halonen M, Lebowitz M, Burrows B. Distribution of IgE in a CD20/CD27 1–3.5% 12–68
community population sample: correlations with age, sex, and allergen skin test
reactivity. J Allergy Clin Immunol 1981;68(2):106–11, with permission. NK Cells
+
−
CD3 /CD16 /CD56 + 6–35% 126–729
Lymphocytes 17–41 1173–2640
Data generated in the Flow Cytometry Section, Immunology Service, DLM, CC, NIH,
Bethesda, MD. The 95% confidence interval for the WBC is 4300–9200/mm . 3
1317