
Page 202 - 9780077418427.pdf
P. 202
/Users/user-f465/Desktop
tiL12214_ch07_177-202.indd Page 179 9/1/10 9:43 PM user-f465
tiL12214_ch07_177-202.indd Page 179 9/1/10 9:43 PM user-f465 /Users/user-f465/Desktop
10 4
Long-wave
10 5 radio waves
10 6 Short-wave
10 7 radio waves
10 8 Microwaves
10 9 (TV, radar, etc.)
10 10 “ Millimeter
Frequency, Hz 10 12 waves” Red 4.3 x 10 14
11
10
10
Infrared light
13
Orange
10
Green
10 14 VISIBLE LIGHT Yellow
15
10 16 Ultraviolet light Blue
10 17 Violet 7.5 x 10 14
10 18 X rays
10 19
10 20 Gamma rays
10 21
FIGURE 7.3 The electromagnetic spectrum. All electromag-
netic waves have the same fundamental character and the same
speed in a vacuum, but many aspects of their behavior depend on
their frequency.
At room temperature the radiation given off from an object
FIGURE 7.1 Light, sounds, and odors can identify the pleasing is in the infrared region, invisible to the human eye. When the
environment of this garden, but light provides the most information. temperature of the object reaches about 700°C (about 1,300°F),
Sounds and odors can be identified and studied directly, but light the peak radiation is still in the infrared region, but the peak has
can only be studied indirectly, that is, in terms of how it behaves. shifted enough toward the higher frequencies that a little visible
As a result, the behavior of light has stimulated scientific investiga- light is emitted as a dull red glow. As the temperature of the object
tions and debate for hundreds of years. Perhaps you have wondered
continues to increase, the amount of radiation increases, and the
about light and its behaviors. What is light?
peak continues to shift toward shorter wavelengths. Th us, the
object begins to glow brighter, and the color changes from red, to
orange, to yellow, and eventually to white. The association of this
color change with temperature is noted in the referent description
of an object being “red hot,” “white hot,” and so forth.
Direction
of wave
UV Visible IR
FIGURE 7.2 The electric and magnetic fields in an electro-
magnetic wave vary together. Here the fields are represented by
arrows that indicate the strength and direction of the fields. Note
Radiation intensity
the fields are perpendicular to one another and to the direction of 6,000K
the wave.
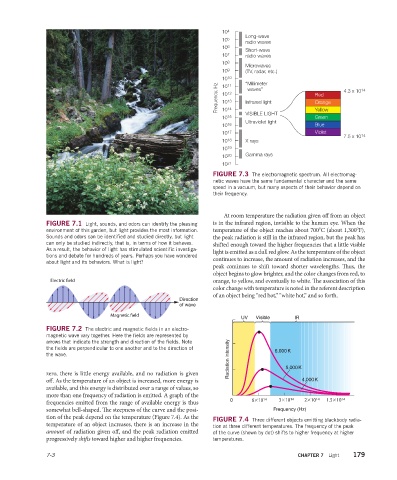
zero, there is little energy available, and no radiation is given 5,000K
off. As the temperature of an object is increased, more energy is 4,000K
available, and this energy is distributed over a range of values, so
more than one frequency of radiation is emitted. A graph of the
frequencies emitted from the range of available energy is thus 0
somewhat bell-shaped. The steepness of the curve and the posi- Frequency (Hz)
tion of the peak depend on the temperature (Figure 7.4). As the
FIGURE 7.4 Three different objects emitting blackbody radia-
temperature of an object increases, there is an increase in the tion at three different temperatures. The frequency of the peak
amount of radiation given off, and the peak radiation emitted of the curve (shown by dot) shifts to higher frequency at higher
progressively shift s toward higher and higher frequencies. temperatures.
7-3 CHAPTER 7 Light 179