
Page 33 - mutual-fund-insight - Mar 2021_Neat
P. 33
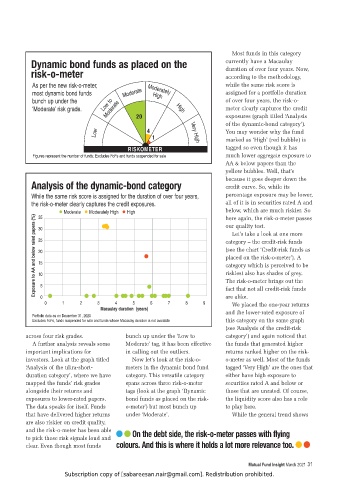
Most funds in this category
            +`UHTPJ IVUK M\UKZ HZ WSHJLK VU [OL                                 currently have a Macaulay
            YPZR V TL[LY                                                        duration of over four years. Now,
                                                                                according to the methodology,
            As per the new risk-o-meter,             Moderately                 while the same risk score is
            most dynamic bond funds         Moderate   High                     assigned for a portfolio duration
            bunch up under the       Low to                                     of over four years, the risk-o-
            ‘Moderate’ risk grade.    Moderate                 High             meter clearly captures the credit

                                                                                exposures (graph titled ‘Analysis
                                                                                of the dynamic-bond category’).
                                  Low                                Very High  You may wonder why the fund
                                                                                marked as ‘High’ (red bubble) is
                                              RISKOMETER                        tagged so even though it has
            Figures represent the number of funds; Excludes FoFs and funds suspended for sale  much lower aggregate exposure to
                                                                                AA & below papers than the
                                                                                yellow bubbles. Well, that’s
                                                                                because it goes deeper down the
            (UHS`ZPZ VM [OL K`UHTPJ IVUK JH[LNVY`                               credit curve. So, while its

            While the same risk score is assigned for the duration of over four years,   percentage exposure may be lower,
            the risk-o-meter clearly captures the credit exposures.             all of it is in securities rated A and
                      z Moderate   z Moderately High   z High                   below, which are much riskier. So
             Exposure to AA and below rated papers (%)  25                      category – the credit-risk funds
              35
                                                                                here again, the risk-o-meter passes
                                                                                our quality test.
              30
                                                                                   Let’s take a look at one more
                                                                                (see the chart ‘Credit-risk funds as
              20
                                                                                placed on the risk-o-meter’). A
              15
                                                                                category which is perceived to be
                                                                                riskiest also has shades of grey.
              10
               5
                                                                                fact that not all credit-risk funds
                                                                                are alike.
               0
                 0     1     2     3     4      5     6     7     8     9       The risk-o-meter brings out the
                                                                                   We placed the one-year returns
                                    Macaulay duration  (years)                  and the lower-rated exposure of
            Portfolio data as on December 31, 2020
            Excludes FoFs, funds suspended for sale and funds whose Macaulay duration is not available  this category on the same graph
                                                                                (see ‘Analysis of the credit-risk
          across four risk grades.           bunch up under the ‘Low to         category’) and again noticed that
            A further analysis reveals some   Moderate’ tag, it has been effective   the funds that generated higher
          important implications for         in calling out the outliers.       returns ranked higher on the risk-
          investors. Look at the graph titled   Now let’s look at the risk-o-   o-meter as well. Most of the funds
          ‘Analysis of the ultra-short-      meters in the dynamic bond fund    tagged ‘Very High’ are the ones that
          duration category’, where we have   category. This versatile category   either have high exposure to
          mapped the funds’ risk grades      spans across three risk-o-meter    securities rated A and below or
          alongside their returns and        tags (look at the graph ‘Dynamic   those that are unrated. Of course,
          exposures to lower-rated papers.   bond funds as placed on the risk-  the liquidity score also has a role
          The data speaks for itself. Funds   o-meter’) but most bunch up       to play here.
          that have delivered higher returns   under ‘Moderate’.                   While the general trend shows
          are also riskier on credit quality,
          and the risk-o-meter has been able      6U [OL KLI[ ZPKL  [OL YPZR V TL[LY WHZZLZ ^P[O MS`PUN
          to pick those risk signals loud and
          clear. Even though most funds   JVSV\YZ  (UK [OPZ PZ ^OLYL P[ OVSKZ H SV[ TVYL YLSL]HUJL [VV


                                                                                        Mutual Fund Insight March 2021 31
                        Subscription copy of [sabareesan.nair@gmail.com]. Redistribution prohibited.