Page 1218 - How to Make Money in Stocks Trilogy
P. 1218

Don’t Invest Blindly: Use Charts to See the Best Time to Buy and Sell 201


                                  Warning Signs

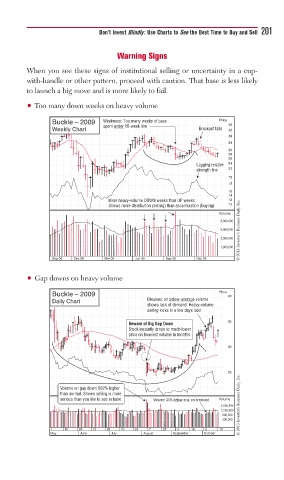
         When you see these signs of institutional selling or uncertainty in a cup-
         with-handle or other pattern, proceed with caution. That base is less likely
         to launch a big move and is more likely to fail.

         • Too many down weeks on heavy volume

                Buckle – 2009  Weakness: Too many weeks of base  Price
                              spent under 10-week line           46
                Weekly Chart                             Breakout fails  42
                                                                 38
                                                                 34
                                                                 30
                                                                 28
                                                                 26
                                                        Lagging relative   24
                                                        strength line   22
                                                                 19
                                                                 17
                                                                 15
                                                                 14
                               More heavy-volume DOWN weeks than UP weeks:  13
                               Shows more distribution (selling) than accumulation (buying)  12
                                                              Volume
                                                               8,000,000
                                                               5,000,000 © 2013 Investor’s Business Daily, Inc.
                                                               3,000,000
                                                               1,800,000
                Sep 08  Dec 08  Mar 09  Jun 09  Sep 09  Dec 09

         • Gap downs on heavy volume

                Buckle – 2009                                 Price  40
                Daily Chart               Breakout on below-average volume
                                          shows lack of demand. Heavy-volume
                                          selling kicks in a few days later.
                                                                 35
                                     Beware of Big Gap Down
                                     Stock instantly drops to much lower
                                     price on heaviest volume in months
                                                                 30


                                                                 25

                  Volume on gap down 502% higher
                  than normal. Shows selling is more
                  serious than you like to see in base.  Volume 34% below avg. on breakout  Volume
                                                               2,500,000 © 2013 Investor’s Business Daily, Inc.
                                                               1,200,000
                                                               600,000
                                                               300,000
               1   15  29  12  26  10  24  7   21  4   18  2  16
               May     June     July     August  September  October
   1213   1214   1215   1216   1217   1218   1219   1220   1221   1222   1223