
Page 1214 - How to Make Money in Stocks Trilogy
P. 1214
Don’t Invest Blindly: Use Charts to See the Best Time to Buy and Sell 197
Mirroring the Market Once Again
Just as double bottoms typically form when the overall market is volatile,
base-on-base patterns often appear when there is uncertainty or significant
selling pressure.
You’ll see stocks make that initial breakout from the prior pattern, but
then the overall market weakens and they quickly pull back to form that sec-
ond base.
The good news is, once the heavy “weight” of a market downturn or sell-
ing pressure is removed, leading stocks break out from these base-on-base
and other patterns and quickly spring higher to new gains.
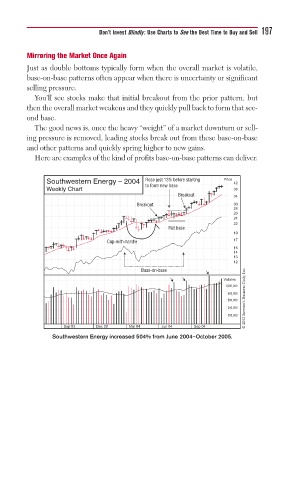
Here are examples of the kind of profits base-on-base patterns can deliver.
Southwestern Energy – 2004 Rose just 13% before starting Price 42
to form new base
Weekly Chart 38
Breakout 34
Breakout 30
28
26
24
22
Flat base
19
Cup-with-handle 17
15
14
13
12
© 2013 Investor’s Business Daily, Inc.
Base-on-base
Volume
1,600,000
960,000
580,000
340,000
200,000
Sep 03 Dec 03 Mar 04 Jun 04 Sep 04
Southwestern Energy increased 504% from June 2004–October 2005.