
Page 1216 - How to Make Money in Stocks Trilogy
P. 1216
Don’t Invest Blindly: Use Charts to See the Best Time to Buy and Sell 199
Go Beyond Just the Shapes
Once you spot the shape of a chart pattern, also look for signs of “accumu-
lation” (institutional buying) and support within the base. That’s how you
separate sound patterns from potentially faulty ones.
This comes back to Big Rock #3 we discussed earlier: Buy stocks being
heavily bought by institutional investors. Avoid those they're heavily selling.
Look for “Clues” in the Daily Stock Analysis Videos
Regularly watching these free videos in the IBD TV section of
Investors.com is an easy way to improve your chart-reading skills. See how
at www.investors.com/GettingStartedBook.
Signs of Institutional Buying
These signals further confirm that big institutional investors are enthusias-
tic about the stock and are buying up shares, providing the fuel for a higher
climb.
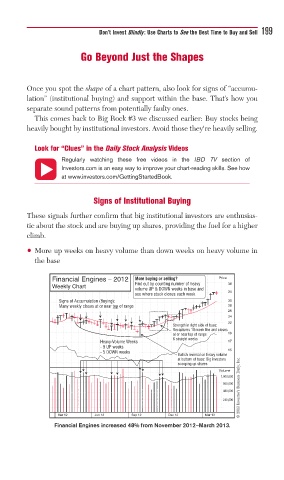
• More up weeks on heavy volume than down weeks on heavy volume in
the base
Financial Engines – 2012 More buying or selling? Price
Weekly Chart Find out by counting number of heavy 38
volume UP & DOWN weeks in base and
see where stock closes each week. 34
Signs of Accumulation (Buying): 30
Many weekly closes at or near top of range 28
26
24
22
Strength in right side of base:
Recaptures 10-week line and closes
at or near top of range 19
6 straight weeks
Heavy-Volume Weeks 17
- 9 UP weeks
- 5 DOWN weeks 15
Bullish reversal on heavy volume
© 2013 Investor’s Business Daily, Inc.
at bottom of base: Big investors
scooping up shares
Volume
1,900,000
960,000
480,000
240,000
Mar 12 Jun 12 Sep 12 Dec 12 Mar 13
Financial Engines increased 48% from November 2012–March 2013.