Page 1217 - How to Make Money in Stocks Trilogy
P. 1217

200  HOW TO MAKE MONEY IN STOCKS—GETTING STARTED


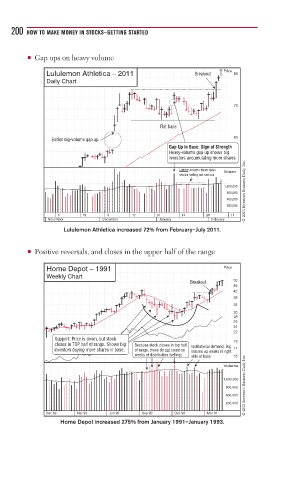
         • Gap ups on heavy volume
              Lululemon Athletica – 2011                Breakout  Price  80
              Daily Chart


                                                                   70


                                              Flat base
               Earlier big-volume gap up                           60
                                                Gap Up in Base: Sign of Strength
                                                Heavy-volume gap up shows big
                                                investors accumulating more shares
                                                                      © 2013 Investor’s Business Daily, Inc.
                                                   Lighter-volume down days  Volume
                                                   shows selling not serious
                                                                1,600,000
                                                                 800,000
                                                                 400,000
                                                                 200,000
                 5      19     3      17     31     14     28     11
              November        December        January       February
                   Lululemon Athletica increased 72% from February–July 2011.


         • Positive reversals, and closes in the upper half of the range

              Home Depot – 1991                                 Price
              Weekly Chart
                                                      Breakout    50
                                                                  46
                                                                  42
                                                                  38
                                                                  34
                                                                  30
                                                                  28
                                                                  26
                                                                  24
                                                                  22
                Support: Price is down, but stock                 19
                closes in TOP half of range. Shows big   Because stock closes in top half   Institutional demand: Big
                investors buying more shares in base.  of range, these do not count as   volume up weeks in right  17
                                       weeks of distribution (selling)  side of base  15
                                                                      © 2013 Investor’s Business Daily, Inc.
                                                                Volume
                                                                1,600,000
                                                                800,000
                                                                400,000
                                                                200,000
              Dec 89   Mar 90   Jun 90   Sep 90   Dec 90   Mar 91
                  Home Depot increased 275% from January 1991–January 1993.
   1212   1213   1214   1215   1216   1217   1218   1219   1220   1221   1222