
Page 242 - How to Make Money in Stocks Trilogy
P. 242
124 A WINNING SYSTEM
ure to undercut may create a faulty, more failure-prone “almost” double bot-
tom. Double bottoms may also have handles, although this is not essential.
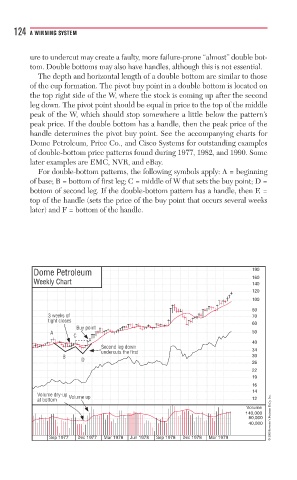
The depth and horizontal length of a double bottom are similar to those
of the cup formation. The pivot buy point in a double bottom is located on
the top right side of the W, where the stock is coming up after the second
leg down. The pivot point should be equal in price to the top of the middle
peak of the W, which should stop somewhere a little below the pattern’s
peak price. If the double bottom has a handle, then the peak price of the
handle determines the pivot buy point. See the accompanying charts for
Dome Petroleum, Price Co., and Cisco Systems for outstanding examples
of double-bottom price patterns found during 1977, 1982, and 1990. Some
later examples are EMC, NVR, and eBay.
For double-bottom patterns, the following symbols apply: A = beginning
of base; B = bottom of first leg; C = middle of W that sets the buy point; D =
bottom of second leg. If the double-bottom pattern has a handle, then E =
top of the handle (sets the price of the buy point that occurs several weeks
later) and F = bottom of the handle.
Dome Petroleum 190
160
Weekly Chart 140
120
100
80
3
3 weeks ofweeks of 70
tight closess
60
Buy pointny t
A A 50
C C
40
Seco
Second leg down ol
unde
undercuts the firstd t th fie first t tt 34
B B 30
D D
26
22
19
16
14
Volume dm r ry-upp p Volume uppeu e upp
at
at bottombottomt 12
Volume
140,000
80,000 © 2009 Investor’s Business Daily, Inc.
40,000
Sep 1977 Dec 1977 Mar 1978 Jun 1978 Sep 1978 Dec 1978 Mar 1979