Page 241 - How to Make Money in Stocks Trilogy
P. 241

How to Read Charts Like a Pro and Improve Your Selection and Timing 123


                     Jack Eckerd                            Price
                                                            50
                     Weekly Chart                           40
                                                            34
                                              Buy
                                              Buy pointu y  pointtpointo  30
                                                            26
                        A A A                C C            22
                                                            19
                                                            16
                                                 D D        14
                                                            12
                                    B B                     10
                                                            8
                                                            7
                                              V Volume upolumee upo  me upppup  6
                                                           Volume  © 2009 Investor’s Business Daily, Inc.
                                                            7,200
                                                            3,200
                                                            1,400
                                                             600
                                                             200
                      Mar 1966  Jun 1966  Sep 1966  Dec 1966  Mar 1967  Jun 1967  Sep 1967
          certain constellations of stars the “Big Dipper” and the “Little Dipper.”) Jack
          Eckerd in April 1967 was an example of the saucer-with-handle base.

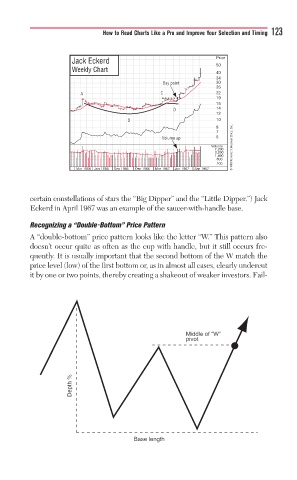
          Recognizing a “Double-Bottom” Price Pattern
          A “double-bottom” price pattern looks like the letter “W.” This pattern also
          doesn’t occur quite as often as the cup with handle, but it still occurs fre-
          quently. It is usually important that the second bottom of the W match the
          price level (low) of the first bottom or, as in almost all cases, clearly undercut
          it by one or two points, thereby creating a shakeout of weaker investors. Fail-


                                                    Middle of “W” ”
                                                    p pivot


                     Depth % Depth%


                                      Base len
                                      Base lengthgt
   236   237   238   239   240   241   242   243   244   245   246