
Page 243 - How to Make Money in Stocks Trilogy
P. 243
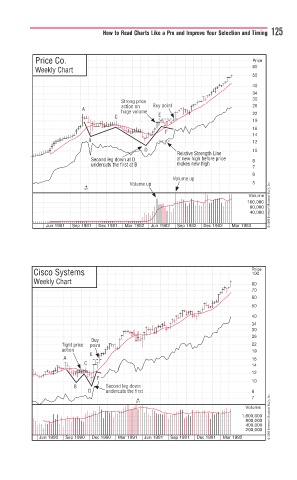
How to Read Charts Like a Pro and Improve Your Selection and Timing 125


           Price Co.                                                  Price
                                                                      60
           Weekly Chart
                                                                      50
                                                                      40
                                                                      34
                                                                      30
                                   Strong price iig
                                   St S
                                           Buy
                                   action
                                   a
                                   action ononn  Buy pointpointy  t t  26
                        A
                                   huge volumeg volu                  22
                                   h
                                 C           E E E
                                                                      19
                                                                      16
                                               F F
                                                                      14
                          B                                           12
                                         D D                          10
                                                  Relative Strength Line
                          Second leg down at D    at new high before price   8
                          undercuts the first at B  makes new high
                                                                      7
                                                                      6
                                                 V Volume upolume upme up
                                     V Volume upolume upmo  p p       5
                         3/1
                                                                     Volume
                                                                     160,000
                                                                      80,000 © 2009 Investor’s Business Daily, Inc.
                                                                      40,000
              Jun 1981  Sep 1981  Dec 1981  Mar 1982  Jun 1982  Sep 1982  Dec 1982  Mar 1983
           Cisco Systems                                              Price
                                                                      100
           Weekly Chart                                               80
                                                                      70
                                                                      60
                                                                      50
                                                                      40
                                                                      34
                                                                      30
                                                                      26
                          Buy
                          Buyyy
                  Tight pricepriceet
                  T Tight  e e  pointn                                22
                          point
                  a
                  action
                  action                                              19
                          E
                   A A                                                16
                         C                                            14
                                                                      12
                            F F F
                                                                      10
                      B       S Second leg downeg d
                          D D D  u undercuts the firsthe firss the  st stt  8
                              undercuts
                                                                      7
                                       2/1
                                                                    Volume
                                                                   1,600,000 © 2009 Investor’s Business Daily, Inc.
                                                                    800,000
                                                                    400,000
                                                                    200,000
            Jun 1990  Sep 1990  Dec 1990  Mar 1991  Jun 1991  Sep 1991  Dec 1991  Mar 1992