Page 244 - How to Make Money in Stocks Trilogy
P. 244

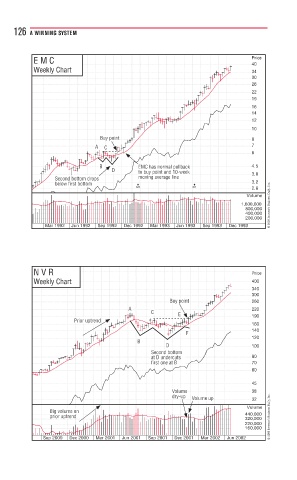
126  A WINNING SYSTEM


           E M C                                                      Price
                                                                      40
           Weekly Chart                                               34
                                                                      30
                                                                      26
                                                                      22
                                                                      19
                                                                      16
                                                                      14
                                                                      12
                                                                      10
                             Buy point t t                            8
                             Buy pointy po
                            A A A  C C C                              7
                                                                      6
                             B B       E EMC         k k              4.5
                                       EMC has nohas non rrmal pullbackmal pullbackapm
                                D D    to buy point and 10-weekyp int auo  e  k  3.8
                                       m
                 Second bottom droppdd bot  s  moving average linenveragng av
                 below first bottomfirst bottomofirst
                 below                                                3.2
                                                                      2.8
                                       3/2            2/1
                                                                     Volume
                                                                   1,600,000 © 2009 Investor’s Business Daily, Inc.
                                                                    800,000
                                                                    400,000
                                                                    200,000
              Mar 1992  Jun 1992  Sep 1992  Dec 1992  Mar 1993  Jun 1993  Sep 1993  Dec 1993


           N V R                                                      Price
           Weekly Chart                                               400
                                                                      340
                                                                      300
                                                B
                                                Buy
                                                Buy pointpointp  t t  260
                                     A A                              220
                                           C
                                                  E E                 190
                      P P Prior uptrender  d
                                                                      160
                                                                      140
                                                    F
                                                                      120
                                       B
                                               D D                    100
                                           Second bottom moecond
                                           at                         80
                                           at D undercuts D undercutssct D un
                                           first one at B one at Btrst on
                                           first                      70
                                                                      60
                                                                      45
                                                V V Volumolumu mee    38
                                                d dry-up p  V Volume uppolume upolume upeu  32
                                                                     Volume
               Big volume on me o
               p p prior uptrendrendi  p pt  d                      440,000 © 2009 Investor’s Business Daily, Inc.
                                                                    320,000
                                                                    220,000
                                                                    160,000
             Sep 2000  Dec 2000  Mar 2001  Jun 2001  Sep 2001  Dec 2001  Mar 2002  Jun 2002
   239   240   241   242   243   244   245   246   247   248   249