
Page 247 - How to Make Money in Stocks Trilogy
P. 247
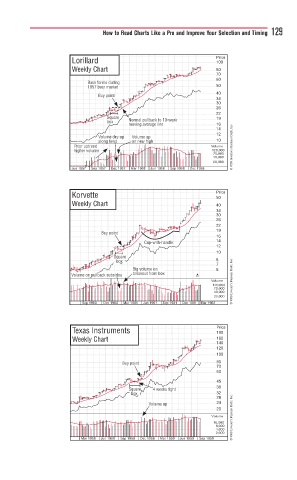
How to Read Charts Like a Pro and Improve Your Selection and Timing 129


                     Lorillard                              Price
                                                            100
                     Weekly Chart                           80
                                                            70
                                                            60
                         Base     g
                         Base forms duringdurinm
                         1957 bear marketbear marketarkea957
                         1957                               50
                                                            40
                            Buy pointi to
                            B
                            Buy pointtyy
                                                            34
                                                            30
                                                            26
                                                            22
                               Sq
                               S S Squareaq  re  N Norrmal pullback to 10-weekmal pullback to 10 weekweek to mal p  k k  19
                                     No
                               b boxo
                                     m
                                     moving
                                     moving average lineaveragering a  g linee line  16
                                        g
                                                            14
                                                            12
                            Volume dlume rry-uppp p p p  Volume up plum
                            along lowslowssong l
                                      on new highnew highgnew
                            along g g  on  g g              10
                      P P P P irior uptrend rend d d       Volume  © 2009 Investor’s Business Daily, Inc.
                          t
                      h h higher volumeolumigheigher volume  120,000
                                                            70,000
                                                            40,000
                                                            20,000
                     Jun 1957  Sep 1957  Dec 1957  Mar 1958  Jun 1958  Sep 1958  Dec 1958
                     Korvette                               Price
                                                            50
                     Weekly Chart                           40
                                                            34
                                                            30
                                                            26
                                                            22
                                                            19
                             Buy pointp poi
                             B B Buy pointii
                                                            16
                                         Cup-with-handleewith-hanwu  14
                                         Cup-with-handlehandle
                                         Cup
                                                            12
                                                            10
                                 S S
                                 Squarea  e
                                 b box                      8
                                 boxx
                                 box
                                                            7
                                      B Big volume on ono
                                      Big volume onovolumvolumevolum
                                      Big                   6
                                      B
                     Volumolume on puln pum  pull  b breakout from boxom bokout  3/1
                          p p pullback subsidesssubsc
                                                           Volume  © 2009 Investor’s Business Daily, Inc.
                                                           120,000
                                                            70,000
                                                            40,000
                                                            20,000
                        Sep 1960  Dec 1960  Mar 1961  Jun 1961  Sep 1961  Dec 1961  Mar 1962
                     Texas Instruments                       Price
                                                             190
                     Weekly Chart                            160
                                                             140
                                                             120
                                                             100
                                   Buy yp ointtt             80
                                    yppoint
                                   Buy pointuy po
                                                             70
                                                             60
                                                             45
                                     S S Squarerq  e  4 4 weekskweeks tighttgtightti htg  38
                                     S
                                     box
                                     b b bo                  32
                                     box
                                                             28
                                          V Volume upppolume upolume upme upolum  24
                                                             20
                                                           Volume © 2009 Investor’s Business Daily, Inc.
                                                            16,000
                                                            8,000
                                                            4,000
                                                            2,000
                        Mar 1958  Jun 1958  Sep 1958  Dec 1958  Mar 1959  Jun 1959  Sep 1959