
Page 245 - How to Make Money in Stocks Trilogy
P. 245
How to Read Charts Like a Pro and Improve Your Selection and Timing 127
eBay Price
140
Weekly Chart 120
100
80
70
60
Buy point is after shake-
3 weeks of fk out at D turns back up 50
g tight closesec by 3 points higher than
low price at B 40
A A 34
C C F Follow-up buy pointll wo b buy p i tt
from e e 30
from 7-week flat bas7 week flat basaeek fla7o
26
B B 22
D
19
S Second bottom at Dtond
undercuts e e e 16
undercuts below first onebelow first onew firstbdercu
at B and reverses up toB and reverses up toes up vB and
at 14
c ose a pea oase ase at ee ee
close at peak for weekr weea
12
V Volume uppolume uppm
2/1
10
Volume
80,000,000
50,000,000 © 2009 Investor’s Business Daily, Inc.
30,000,000
18,000,000
Jun 2002 Sep 2002 Dec 2002 Mar 2003 Jun 2003 Sep 2003 Dec 2003 Mar 2004
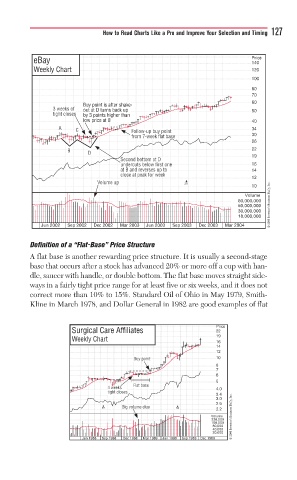
Definition of a “Flat-Base” Price Structure
A flat base is another rewarding price structure. It is usually a second-stage
base that occurs after a stock has advanced 20% or more off a cup with han-
dle, saucer with handle, or double bottom. The flat base moves straight side-
ways in a fairly tight price range for at least five or six weeks, and it does not
correct more than 10% to 15%. Standard Oil of Ohio in May 1979, Smith -
Kline in March 1978, and Dollar General in 1982 are good examples of flat
Price
Surgical Care Affiliates 22
19
Weekly Chart 16
14
12
Buy
Buy point 10
Buy pointtpointn
8
7
6
5
F Flat baseeb
4
4 4 weeks
4 eekseekseeks 4.0
tigh
tight closesht clo
3.4
3.0
2.6
Big volume cluee clu vol
Big volume clue
5/4 3/2
2.2
Volume © 2009 Investor’s Business Daily, Inc.
320,000
160,000
80,000
40,000
20,000
Jun 1988 Sep 1988 Dec 1988 Mar 1989 Jun 1989 Sep 1989 Dec 1989