
Page 252 - How to Make Money in Stocks Trilogy
P. 252
134 A WINNING SYSTEM
Price
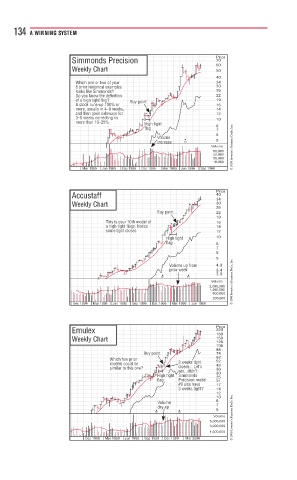
Simmonds Precision 70
60
Weekly Chart 50
40
Which one or two of your one or two of yourooor toh
Which 34
8 8 prior historical examples prior historical examplesmplesxtoricp 30
looks like Simmonds?like Simmonds?dSimmko
looks 26
Do you know the definition you know the definitionnitionow t 22
Do
of B Buy pointtuy p ointti 19
of a high tight flag?a high tight flag??ghtga
yp
yp
A A stock stockks r runs-up 100% oruns up 100% or%00%ns-un 16
more, usually in 4–8 weeksusually in 4 8 weeksk–8 wiusuao
more , 14
and then goes sideways forthen goes sideways foroewayen god
and 12
3–5 weeks coeks5 r rrecting no ging n 10
more than 10–25%%–hano Hig
High tighttighi Hig
fl flaga f g g 8
7
6
Volumemoolool
increaseac
increase 3/1 5
Volume © 2009 Investor’s Business Daily, Inc.
80,000
50,000
30,000
18,000
Mar 1965 Jun 1965 Sep 1965 Dec 1965 Mar 1966 Jun 1966 Sep 1966
Price
Accustaff 40
34
Weekly Chart 30
26
Buy 22
Buy pointtyy
Buy pointpoint
19
Thisi isiss youryouru 10th10th0
model
modeld ofoffoo
This m 16
a a high tight flags. Noticehigh tight flags. Noticetgs.high 14
some
some tight closestight closesstme t g 12
High tightigh tightttg
H H Hi t t t 10
flagga f g g 8
7
6
5
V V Volume up fromolume up fromm up fu m m 4.0
p
prior
p p prior weekweeker 3.4
3.0
2/1 3/1
Volume © 2009 Investor’s Business Daily, Inc.
3,000,000
1,400,000
600,000
200,000
Dec 1994 Mar 1995 Jun 1995 Sep 1995 Dec 1995 Mar 1996 Jun 1996
Emulex Price
220
180
Weekly Chart 150
126
106
88
Buy pointy poi ntt 74
Buy
yppoint
yp
62
i
Whi
Whic
Which few priorph fe prior 52
3
models could bed l coul
mod
m ld bd be 3 weeksweekskweeeeks s s tight tightg 43
clos
oses... Let’s ses... Lss ss
s s
similar to this one?a oto thi s o e? clososes. Let’s 36
se se ee...didn’tdid ’t’te...di
Hi H
High tghg tightghtg ti ti t t SimmondsSimmoS ds 30
25
flag
flagg g g Precision model ec s o mecisi ode 21
#9 17
#9 also have also haveaalso
3 3 weeks tight?weeks tight?gweek g g 14
12
10
V Volumeolumelume e e e 8
d drypyy-upy 7
6
2/1 2/1
Volume © 2009 Investor’s Business Daily, Inc.
5,000,000
3,000,000
1,600,000
Dec 1998 Mar 1999 Jun 1999 Sep 1999 Dec 1999 Mar 2000