
Page 254 - How to Make Money in Stocks Trilogy
P. 254
136 A WINNING SYSTEM
Price
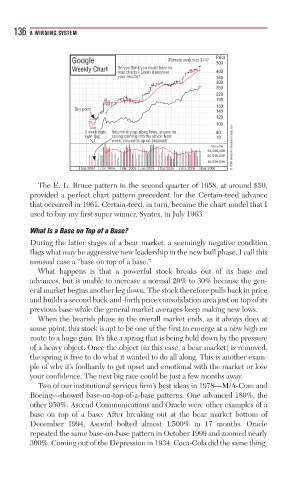
Google Ultimate peak was $747 500
Ultimate peak was $747seaktt
Weekly Chart D Do you think you could leaouldk youou t rn tonto
read chachachae
read r rts? Could it improvets? Could it improvevit im? Cou 400
y
your results??resuo 340
300
260
220
190
160
Buy pointy poi
Buy point
140
120
100
3 3 3 week hweekek hh high h V V Volume dolume dme drry-up along lows, shows ny up along lows, shows nows, shog lo-up o o 80
h
high
g g g tight flala g g g g g ag g g s selling coming into the stock. Next gng co ing i the ck. N 70
g
week, volume is up on breakoutakouton bme isk, vo p
w
Volume © 2009 Investor’s Business Daily, Inc.
50,000,000
30,000,000
16,000,000
Sep 2004 Dec 2004 Mar 2005 Jun 2005 Sep 2005 Dec 2005 Mar 2006
The E. L. Bruce pattern in the second quarter of 1958, at around $50,
provided a perfect chart pattern precedent for the Certain-teed advance
that occurred in 1961. Certain-teed, in turn, became the chart model that I
used to buy my first super winner, Syntex, in July 1963.
What Is a Base on Top of a Base?
During the latter stages of a bear market, a seemingly negative condition
flags what may be aggressive new leadership in the new bull phase. I call this
unusual case a “base on top of a base.”
What happens is that a powerful stock breaks out of its base and
advances, but is unable to increase a normal 20% to 30% because the gen-
eral market begins another leg down. The stock therefore pulls back in price
and builds a second back-and-forth price consolidation area just on top of its
previous base while the general market averages keep making new lows.
When the bearish phase in the overall market ends, as it always does at
some point, this stock is apt to be one of the first to emerge at a new high en
route to a huge gain. It’s like a spring that is being held down by the pressure
of a heavy object. Once the object (in this case, a bear market) is removed,
the spring is free to do what it wanted to do all along. This is another exam-
ple of why it’s foolhardy to get upset and emotional with the market or lose
your confidence. The next big race could be just a few months away.
Two of our institutional services firm’s best ideas in 1978—M/A-Com and
Boeing—showed base-on-top-of-a-base patterns. One advanced 180%, the
other 950%. Ascend Communications and Oracle were other examples of a
base on top of a base. After breaking out at the bear market bottom of
December 1994, Ascend bolted almost 1,500% in 17 months. Oracle
repeated the same base-on-base pattern in October 1999 and zoomed nearly
300%. Coming out of the Depression in 1934, Coca-Cola did the same thing.