Page 256 - How to Make Money in Stocks Trilogy
P. 256

138  A WINNING SYSTEM


          Ascending Bases
          Ascending bases, like flat bases, occur midway along a move up after a stock
          has run up off an earlier base. They have three 10% to 20% pullbacks with
          each low in price during the sell-off being higher than the preceding one,
          which is why I call them ascending bases.
            Each pullback occurs due to the general market declining at the time.
            Boeing formed a 13-week ascending base in the second quarter of 1954
          and then doubled in price. Redman Industries, a builder of mobile homes,
          had an 11-week ascending base in the first quarter of 1968 and proceeded
          to increase 500% in just 37 weeks. America Online created the same type of
          base in the first quarter of 1999 and resumed what turned out to be a 500%
          run-up from the breakout of a 14-week cup with handle in October 1998.
            So you see, history does repeat itself. The more historical patterns you
          learn to recognize, the more money you should be able to make in future
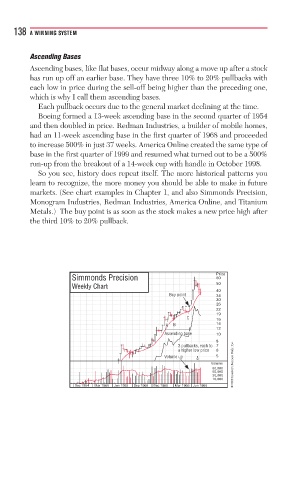
          markets. (See chart examples in Chapter 1, and also Simmonds Precision,
          Monogram Industries, Redman Industries, America Online, and Titanium
          Metals.)  The buy point is as soon as the stock makes a new price high after
          the third 10% to 20% pullback.


                                                            Price
                     Simmonds Precision                     60
                     Weekly Chart                           50
                                                            40
                                                Buy point t t  34
                                                Buy pointu
                                                 ypointoint
                                                            30
                                                            26
                                                            22
                                                            19
                                                    C       16
                                               A A A A  B B  14
                                                            12
                                                   g g
                                              Ascending
                                              A Ascending basbasbndinggg bas se see  10
                                                            8
                                                  3 3 3 pullbacks, each topullbacks each toullba  7
                                                  3 3
                                                  a higher low priceghighergher  6
                                                  a a higher low pricelow pricew
                                                  a a
                                              V V Volume uppolume upolume upum  5
                                                       3/1
                                                           Volume  © 2009 Investor’s Business Daily, Inc.
                                                           80,000
                                                           50,000
                                                           30,000
                                                           18,000
                      Dec 1964  Mar 1965  Jun 1965  Sep 1965  Dec 1965  Mar 1966  Jun 1966
   251   252   253   254   255   256   257   258   259   260   261