Page 255 - How to Make Money in Stocks Trilogy
P. 255

How to Read Charts Like a Pro and Improve Your Selection and Timing 137


                                                            Price
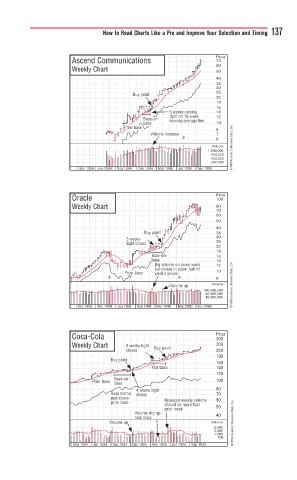
                     Ascend Communications                  70
                                                            60
                     Weekly Chart                           50
                                                            40
                                                            34
                                                            30
                                                            26
                                      B
                                      Buy pointiuy po  t t tt t
                                       yp
                                       yp
                                                            22
                                                            19
                                                            16
                                                3 3 weeks closing weeks closingosingse  14
                                                tight
                                                tight on 10-weekon 10 week-weent
                                         B Base-s -o  movingv  averageerage line e  12
                                           -on-n
                                         basese
                                         base e e           10
                                   P Prior baseor basririo
                                                            8
                                           V Volume increaseolume increasecreaseu  e e  7
                                                   2/1      6
                                                           Volume © 2009 Investor’s Business Daily, Inc.
                                                          1,600,000
                                                           800,000
                                                           400,000
                                                           200,000
                       Mar 1994  Jun 1994  Sep 1994  Dec 1994  Mar 1995  Jun 1995  Sep 1995
                     Oracle                                 Price
                                                            100
                     Weekly Chart                           80
                                                            70
                                                            60
                                                            50
                                                            40
                                         Buy point
                                         Buy
                                         Buy pointyppointy po  34
                                                            30
                                    3
                                    3 3 3 weeks kwee
                                    t t tight closesht l eght c  26
                                    ti
                                                            22
                                                            19
                                           Base-oo
                                           Baseaasea  ono o on-o o o o  16
                                           as as a base
                                           baaase           14
                                            se se
                                            Big
                                            B Bi B Big volumevolumev l  on  12
                                                 o
                                                 on downdowndown weekweeke
                                            b
                                            but closes in upper half ofperes inclose
                                    P Pr or baserbasebriorioio  week’s pricesk’k’s p p p i s  10
                                            w
                               3/2                2/1       8
                                                           Volume
                                                Volume upume     © 2009 Investor’s Business Daily, Inc.
                                                         160,000,000
                                                          80,000,000
                                                          40,000,000
                       Dec 1998  Mar 1999  Jun 1999  Sep 1999  Dec 1999  Mar 2000  Jun 2000
                     Coca-Cola                              Price
                                                            300
                     Weekly Chart   5 weeks tightweeks tightks tigw  t t  B Buy pointpoint  260
                                    5
                                            B
                                    closesso                220
                                    closes
                                                            190
                                Buy pointyy
                                Buy pointn
                                B
                                                            160
                                           Flat baseebaseaa
                                           Flat base
                                           Flat             140
                                                            120
                                 Base-on-ase-o
                           P P P Prior baserior basebo      100
                                 b basea
                                       4 4 4 weeks tightweeks tight tighe  t t  80
                                Base  r r r sssmsms  c closes  70
                                Base fofos
                                       closese
                                just above t abo  Breakout weekly volumeweekly volumekly vo  60
                                j
                                              Breakout weekly volumeekltout we
                                              Breakout
                                p prior baseior bas
                                  b
                                              should be more than e th be mo  50
                                              prior weekio  w  k
                                      V Volume dme dry-upu p  40
                                      near lowslows
                               V V Volume upme u p         Volume  © 2009 Investor’s Business Daily, Inc.
                                                            6,400
                                                            2,600
                                                            1,000
                                                             400
                      Mar 1934  Jun 1934  Sep 1934  Dec 1934  Mar 1935  Jun 1935  Sep 1935
   250   251   252   253   254   255   256   257   258   259   260