
Page 266 - SK Year 5 Mathematics DLP
P. 266
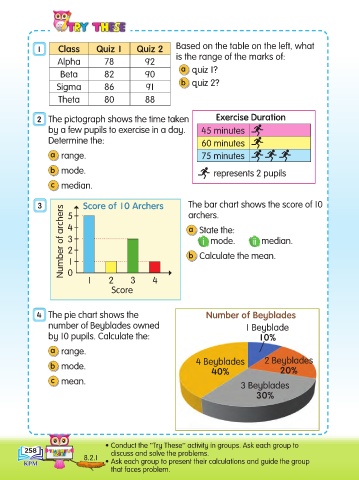
1     Class       Quiz 1      Quiz 2      Based on the table on the left, what
                                                           is the range of the marks of:
                       Alpha         78          92
                                                             a  quiz 1?
                        Beta         82          90
                                                             b  quiz 2?
                       Sigma         86           91
                       Theta         80          88

                 2   The pictograph shows the time taken               Exercise Duration
                    by a few pupils to exercise in a day.         45 minutes
                    Determine the:                                60 minutes

                     a  range.                                    75 minutes

                     b  mode.                                         represents 2 pupils

                     c  median.


                 3        5    Score of 10 Archers              The bar chart shows the score of 10
                         Number of archers  4                 a  State the:       ii  median.
                                                              archers.


                          3
                                                                     mode.
                                                                   i
                          2
                                                              b  Calculate the mean.
                          1
                          0
                                1     2      3      4
                                       Score


                 4   The pie chart shows the                        Number of Beyblades
                    number of Beyblades owned                                   1 Beyblade
                    by 10 pupils. Calculate the:                                    10%

                     a  range.
                                                                 4 Beyblades         2 Beyblades
                     b  mode.
                                                                     40%                  20%
                     c  mean.
                                                                              3 Beyblades
                                                                                   30%


                                     • Conduct the ‟Try These” activity in groups. Ask each group to
             258                       discuss and solve the problems.
                               8.2.1
                                     • Ask each group to present their calculations and guide the group
                                       that faces problem.