
Page 42 - T-I JOURNAL19 4
P. 42
690 MERCIER, RANJIT & REARDON
Table 1. Gender Differences among Creators
Gender Representation in Creator Population
Creator Type 2011 2012 2013 2014 2015 2016
Non-Faculty Male 78 85 96 95 93 119
Non-Faculty Female 33 49 32 43 41 55
Male Faculty 142 118 145 130 143 172
Female Faculty 24 26 26 26 30 33
The above table shows the proportion of gender-specific faculty and non-faculty members who submitted an invention disclosure
for the years from 2011 to 2016. Non-faculty includes postdoctoral fellows, graduate students, and university staff members.
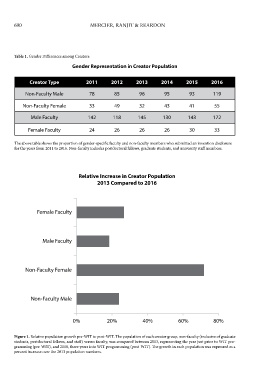
Relative Increase in Creator Population
2013 Compared to 2016
Female Faculty
Male Faculty
Non-Faculty Female
Non-Faculty Male
0% 20% 40% 60% 80%
Figure 1. Relative population growth pre-WIT to post-WIT. The population of each creator group, non-faculty (inclusive of graduate
students, postdoctoral fellows, and staff) versus faculty, was compared between 2013, representing the year just prior to WIT pro-
gramming (pre-WIT), and 2016, three years into WIT programming (post-WIT). The growth in each population was expressed as a
percent increase over the 2013 population numbers.