
Page 44 - T-I JOURNAL19 4
P. 44
692 MERCIER, RANJIT & REARDON
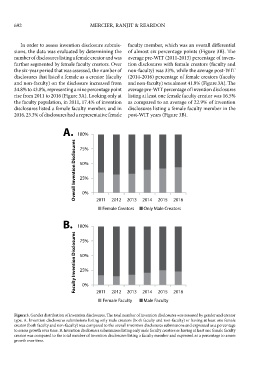
In order to assess invention disclosure submis- faculty member, which was an overall differential
sions, the data was evaluated by determining the of almost six percentage points (Figure 3B). The
number of disclosures listing a female creator and was average pre-WIT (2011-2013) percentage of inven-
further segmented by female faculty creators. Over tion disclosures with female creators (faculty and
the six-year period that was assessed, the number of non-faculty) was 33%, while the average post-WIT
disclosures that listed a female as a creator (faculty (2014-2016) percentage of female creators (faculty
and non-faculty) on the disclosure increased from and non-faculty) was almost 41.8% (Figure 3A). The
34.8% to 43.8%, representing a nine percentage point average pre-WIT percentage of invention disclosures
rise from 2011 to 2016 (Figure 3A). Looking only at listing at least one female faculty creator was 16.5%
the faculty population, in 2011, 17.4% of invention as compared to an average of 22.9% of invention
disclosures listed a female faculty member, and in disclosures listing a female faculty member in the
2016, 23.3% of disclosures had a representative female post-WIT years (Figure 3B).
A. 100%
Overall Invention Disclosures 50%
75%
25%
0%
2012
2013
2011
Only Male Creators
Female Creators 2014 2015 2016
B. 100%
Faculty Invention Disclosures 50%
75%
25%
0%
2011
2012
2013
Male Faculty
Female Faculty 2014 2015 2016
Figure 3. Gender distribution of invention disclosures. The total number of invention disclosures was assessed by gender and creator
type. A. Invention disclosures submissions listing only male creators (both faculty and non-faculty) or having at least one female
creator (both faculty and non-faculty) was compared to the overall invention disclosures submissions and expressed as a percentage
to assess growth over time. B. Invention disclosures submissions listing only male faculty creators or having at least one female faculty
creator was compared to the total number of invention disclosures listing a faculty member and expressed as a percentage to assess
growth over time.