
Page 46 - T-I JOURNAL19 4
P. 46
694 MERCIER, RANJIT & REARDON
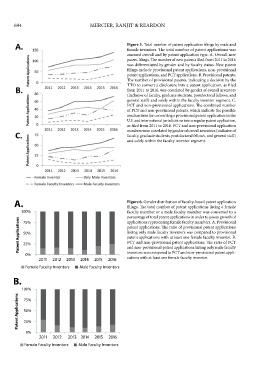
Figure 5. Total number of patent application filings by male and
female inventors. The total number of patent applications was
assessed overall and by patent application type. A. Overall new
patent filings. The number of new patents filed from 2011 to 2016
was differentiated by gender and by faculty status. New patent
filings include provisional patent applications, non-provisional
patent applications, and PCT applications. B. Provisional patents.
The number of provisional patents, indicating a decision by the
TTO to convert a disclosure into a patent application, as filed
from 2011 to 2016, was correlated by gender of overall inventors
(inclusive of faculty, graduate students, postdoctoral fellows, and
general staff) and solely within the faculty inventor segment. C.
PCT and non-provisional applications. The combined number
of PCT and non-provisional patents, which indicate the possible
mechanisms for converting a provisional patent application in the
U.S. and international jurisdictions into a regular patent application,
as filed from 2011 to 2016. PCT and non-provisional application
numbers were correlated by gender of overall inventors (inclusive of
faculty, graduate students, postdoctoral fellows, and general staff)
and solely within the faculty inventor segment.
A.
A. Figure 6. Gender distribution of faculty-based patent application
filings. The total number of patent applications listing a female
100%
100% faculty member or a male faculty member was converted to a
percentage of total patent applications in order to assess growth of
Patent Applications Patent Applications 50% patent applications. The ratio of provisional patent applications
applications representing female faculty members. A. Provisional
75%
75%
listing only male faculty inventors was compared to provisional
50%
patent applications with at least one female faculty inventor. B.
PCT and non-provisional patent applications. The ratio of PCT
25%
25%
inventors was compared to PCT and non-provisional patent appli-
0%
0% and non-provisional patent applications listing only male faculty
cations with at least one female faculty inventor.
2016
2013
2012
2011
2014
2015
2011 2012 2013 2014 2015 2016
Female Faculty Inventors
Male Faculty Inventors
Female Faculty Inventors Male Faculty Inventors
B.
B.
100%
100%
Patent Applications Patent Applications 50%
75%
75%
50%
25%
25%
0%
0%
2012
2013 2014
2015
2016
2011
2011 2012 2013 2014 2015 2016
Female Faculty Inventors
Male Faculty Inventors
Female Faculty Inventors Male Faculty Inventors