
Page 43 - T-I JOURNAL19 4
P. 43
690 MERCIER, RANJIT & REARDON WOMEN INNOVATOR PROGRAMS IN ACADEMIA 691
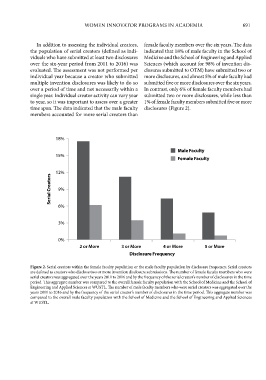
In addition to assessing the individual creators, female faculty members over the six years. The data
the population of serial creators (defined as indi- indicated that 18% of male faculty in the School of
Table 1. Gender Differences among Creators viduals who have submitted at least two disclosures Medicine and the School of Engineering and Applied
Gender Representation in Creator Population over the six-year period from 2011 to 2016) was Sciences (which account for 98% of invention dis-
evaluated. The assessment was not performed per closures submitted to OTM) have submitted two or
individual year because a creator who submitted more disclosures, and almost 5% of male faculty had
Creator Type 2011 2012 2013 2014 2015 2016 multiple invention disclosures was likely to do so submitted five or more disclosures over the six years.
over a period of time and not necessarily within a In contrast, only 6% of female faculty members had
Non-Faculty Male 78 85 96 95 93 119 single year. Individual creator activity can vary year submitted two or more disclosures, while less than
to year, so it was important to assess over a greater 1% of female faculty members submitted five or more
Non-Faculty Female 33 49 32 43 41 55 time span. The data indicated that the male faculty disclosures (Figure 2).
members accounted for more serial creators than
Male Faculty 142 118 145 130 143 172
Female Faculty 24 26 26 26 30 33
18%
The above table shows the proportion of gender-specific faculty and non-faculty members who submitted an invention disclosure
for the years from 2011 to 2016. Non-faculty includes postdoctoral fellows, graduate students, and university staff members. Male Faculty
15%
Female Faculty
12%
Relative Increase in Creator Population
Serial Creators 9%
2013 Compared to 2016
6%
Female Faculty
3%
Male Faculty 0%
2 or More 3 or More 4 or More 5 or More
Disclosure Frequency
Figure 2. Serial creators within the female faculty population or the male faculty population by disclosure frequency. Serial creators
Non-Faculty Female are defined as creators who disclose two or more invention disclosure submissions. The number of female faculty members who were
serial creators was aggregated over the years 2011 to 2016 and by the frequency of the serial creator’s number of disclosures in the time
period. This aggregate number was compared to the overall female faculty population with the School of Medicine and the School of
Engineering and Applied Sciences at WUSTL. The number of male faculty members who were serial creators was aggregated over the
years 2011 to 2016 and by the frequency of the serial creator’s number of disclosures in the time period. This aggregate number was
Non-Faculty Male compared to the overall male faculty population with the School of Medicine and the School of Engineering and Applied Sciences
at WUSTL.
0% 20% 40% 60% 80%
Figure 1. Relative population growth pre-WIT to post-WIT. The population of each creator group, non-faculty (inclusive of graduate
students, postdoctoral fellows, and staff) versus faculty, was compared between 2013, representing the year just prior to WIT pro-
gramming (pre-WIT), and 2016, three years into WIT programming (post-WIT). The growth in each population was expressed as a
percent increase over the 2013 population numbers.