
Page 45 - T-I JOURNAL19 4
P. 45
WOMEN INNOVATOR PROGRAMS IN ACADEMIA 693
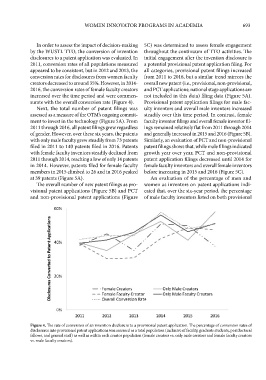
In order to assess the impact of decision-making 5C) was determined to assess female engagement
by the WUSTL TTO, the conversion of invention throughout the continuum of TTO activities. The
disclosures to a patent application was evaluated. In initial engagement after the invention disclosure is
2011, conversion rates of all populations measured a potential provisional patent application filing. For
appeared to be consistent, but in 2012 and 2013, the all categories, provisional patent filings increased
conversion rates for disclosures from women faculty from 2011 to 2016, but a similar trend mirrors the
creators decreased to around 35%. However, in 2014- overall new patent (i.e., provisional, non-provisional,
2016, the conversion rates of female faculty creators and PCT applications; national stage applications are
increased over the time period and were commen- not included in this data) filing data (Figure 5A).
surate with the overall conversion rate (Figure 4). Provisional patent application filings for male fac-
Next, the total number of patent filings was ulty inventors and overall male inventors increased
assessed as a measure of the OTM’s ongoing commit- steadily over this time period. In contrast, female
ment to invest in the technology (Figure 5A). From faculty inventor filings and overall female inventor fil-
2011 through 2016, all patent filings grew regardless ings remained relatively flat from 2011 through 2014
of gender. However, over these six years, the patents and generally increased in 2015 and 2016 (Figure 5B).
with only male faculty grew steadily from 73 patents Similarly, an evaluation of PCT and non-provisional
filed in 2011 to 140 patents filed in 2016. Patents patent filings shows that, while male filings indicated
with female faculty inventors steadily declined from growth year over year, PCT and non-provisional
2011 through 2014, reaching a low of only 14 patents patent application filings decreased until 2014 for
in 2014. However, patents filed for female faculty female faculty inventors and overall female inventors
members in 2015 climbed to 26 and in 2016 peaked before increasing in 2015 and 2016 (Figure 5C).
at 39 patents (Figure 5A). An evaluation of the percentage of men and
The overall number of new patent filings as pro- women as inventors on patent applications indi-
visional patent applications (Figure 5B) and PCT cated that, over the six-year period, the percentage
and non-provisional patent applications (Figure of male faculty inventors listed on both provisional
Figure 4. The rate of conversion of an invention disclosure to a provisional patent application. The percentage of conversion rates of
disclosures into provisional patent applications was assessed as a total population (inclusive of faculty, graduate students, postdoctoral
fellows, and general staff) as well as within each creator population (female creators vs. only male creators and female faculty creators
vs. male faculty creators).