
Page 107 - MARSIUM'21 COMP OF PAPER
P. 107
84 Nadia Safian (2021)
4.1 DATA ANALYSIS
The quantitative data obtained from the conduction of online survey had been analyzed through the application of Social Sciences
Statistical Package (SPSS). Three-fold of analysis were involved to accomplish the success of this research study. It has started with
descriptive statistics in which frequencies analysis was performed. It was used to measure the demographic information provided by the
respondents and the results will reflect the variable identification or means. It helps to give a table summary and understand the descriptive
analysis background and the data distribution. The data analysis was performed in two phases, of which the examination of model measuring
is at the first phase and the construction of a complete structural equation model is carried out at the second phase. (Dhiman, 2019).
The first phase of the analysis is carrying out the normality test and reliability test. Data normality was measured based on skewness
(the approval range ±2) and kurtosis (the approval range ±7), (Hair, 2010). Cronbach’s Alpha was assesed the reliability of likert scale of item
dimension. The cronbach’s alpha that represents internal consistency are acceptable with ≥.7 and preferable ≥.8 as implied excellent internal
consistency (DeVellis, 2012). The second phase of the analysis is followed by Multiple Linear Regression. The assess of p-value is to evaluate
the relationship between independent variables and the dependent variable. The result of the regression that relies on the size of the coefficeint
that identifies the highest factors that influence the dependent variable. When the p-value is ≤.5, the multiple linear regression is significant
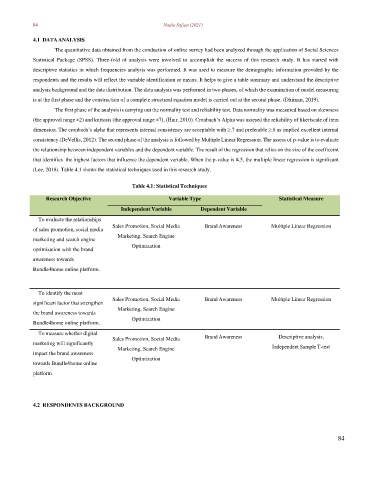
(Lee, 2018). Table 4.1 shows the statistical techniques used in this research study.
Table 4.1: Statistical Techniques
Research Objective Variable Type Statistical Measure
Independent Variable Dependent Variable
To evaluate the relationships
Sales Promotion, Social Media Brand Awareness Multiple Linear Regression
of sales promotion, social media
Marketing, Search Engine
marketing and search engine
Optimization
optimization with the brand
awareness towards
Bundle4home online platform.
To identify the most
Sales Promotion, Social Media Brand Awareness Multiple Linear Regression
significant factor that strengthen
Marketing, Search Engine
the brand awareness towards
Optimization
Bundle4home online platform.
To measure whether digital
Sales Promotion, Social Media Brand Awareness Descriptive analysis,
marketing will significantly
Marketing, Search Engine Independent Sample T-test
impact the brand awareness
Optimization
towards Bundle4home online
platform.
4.2 RESPONDENTS BACKGROUND
84