
Page 108 - MARSIUM'21 COMP OF PAPER
P. 108
85 Nadia Safian (2021)
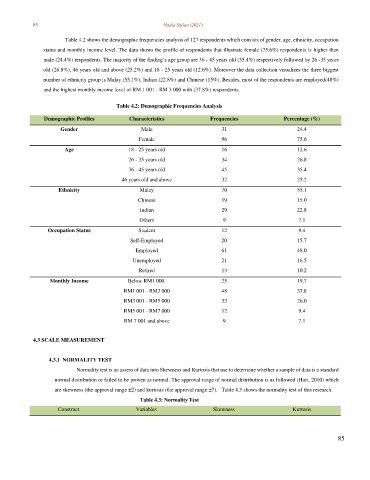
Table 4.2 shows the demographic frequencies analysis of 127 respondents which consists of gender, age, ethnicity, occupation
status and monthly income level. The data shows the profile of respondents that illustrate female (75.6%) respondents is higher than
male (24.4%) respondents. The majority of the finding’s age group are 36 - 45 years old (35.4%) respectively followed by 26 -35 years
old (26.8%), 46 years old and above (25.2%) and 18 - 25 years old (12.6%). Moreover the data collection visualizes the three biggest
number of ethnicity group is Malay (55.1%), Indian (22.8%) and Chinese (15%). Besides, most of the respondents are employed(48%)
and the highest monthly income level of RM 1 001 - RM 3 000 with (37.8%) respondents.
Table 4.2: Demographic Frequencies Analysis
Demographic Profiles Characteristics Frequencies Percentage (%)
Gender Male 31 24.4
Female 96 75.6
Age 18 - 25 years old 16 12.6
26 - 35 years old 34 26.8
36 - 45 years old 45 35.4
46 years old and above 32 25.2
Ethnicity Malay 70 55.1
Chinese 19 15.0
Indian 29 22.8
Others 9 7.1
Occupation Status Student 12 9.4
Self-Employed 20 15.7
Employed 61 48.0
Unemployed 21 16.5
Retired 13 10.2
Monthly Income Below RM1 000 25 19.7
RM1 001 - RM3 000 48 37.8
RM3 001 - RM5 000 33 26.0
RM5 001 - RM7 000 12 9.4
RM 7 001 and above 9 7.1
4.3 SCALE MEASUREMENT
4.3.1 NORMALITY TEST
Normality test is an assess of data into Skewness and Kurtosis that use to determine whether a sample of data is a standard
normal distribution or failed to be proven as normal. The approval range of normal distribution is as followed (Hair, 2010) which
are skewness (the approval range ±2) and kurtosis (the approval range ±7). Table 4.3 shows the normality test of this research.
Table 4.3: Normality Test
Construct Variables Skewness Kurtosis
85