
Page 111 - MARSIUM'21 COMP OF PAPER
P. 111
88 Nadia Safian (2021)
Sample Group Result
T-test Sig. (2-tailed) .000 (p<.05)
Means Pre-survey 3.293
Post-survey 4.380
The result shown in Table 4.6 Independent t-test for pre and post survey indicates the sig(2-tailed) of 0.000 which is p<0.05,
hence the variables are significant. The significant different between two groups were proved to be shown, with values Pre-aurvey
(3.293) and Post-survey (4.380). Thus, the research explain that the intervention of digital marketing elements will influence Brand
Awareness.
4.5 MULTIPLE LINEAR REGRESSION
The implementation of multiple linear regression is to evaluate the direct relationship between independent and dependent
variables. The variable must be within the interval range to show the significant relationship towards independent variable and dependent
variable. The rules of thumb is the significant values must be less than 0.05 to indicate the positive result. Additionally, the determination
of the most significant relationship had to be followed on the highest standardized coefficient beta,β (ignoring any negative signs out of
the front)
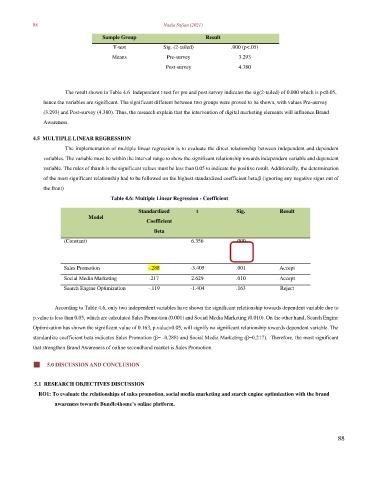
Table 4.6: Multiple Linear Regression - Coefficient
Standardized t Sig. Result
Model
Coefficient
Beta
(Constant) 6.356 .000
Sales Promotion -.288 -3.405 .001 Accept
Social Media Marketing .217 2.629 .010 Accept
Search Engine Optimization -.119 -1.404 .163 Reject
According to Table 4.6, only two independent variables have shown the significant relationship towards dependent variable due to
p.value is less than 0.05, which are calculated Sales Promotion (0.001) and Social Media Marketing (0.010). On the other hand, Search Engine
Optimization has shown the significant value of 0.163, p.value>0.05, will signify no significant relationship towards dependent variable. The
standardize coefficient beta indicates Sales Promotion (β= -0.288) and Social Media Marketing (β=0.217). Therefore, the most significant
that strengthen Brand Awareness of online secondhand market is Sales Promotion.
⬛ 5.0 DISCUSSION AND CONCLUSION
5.1 RESEARCH OBJECTIVES DISCUSSION
RO1: To evaluate the relationships of sales promotion, social media marketing and search engine optimization with the brand
awareness towards Bundle4home’s online platform.
88