
Page 140 - MARSIUM'21 COMP OF PAPER
P. 140
CHAI JING MIN (2022)
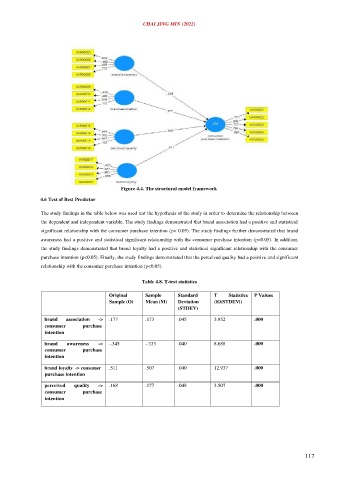
Figure 4.4. The structural model framework
4.6 Test of Best Predictor
The study findings in the table below was used test the hypothesis of the study in order to determine the relationship between
the dependent and independent variable. The study findings demonstrated that brand association had a positive and statistical
significant relationship with the consumer purchase intention (p< 0.05). The study findings further demonstrated that brand
awareness had a positive and statistical significant relationship with the consumer purchase intention (p<0.05). In addition,
the study findings demonstrated that brand loyalty had a positive and statistical significant relationship with the consumer
purchase intention (p<0.05). Finally, the study findings demonstrated that the perceived quality had a positive and significant
relationship with the consumer purchase intention (p<0.05).
Table 4.8. T-test statistics
Original Sample Standard T Statistics P Values
Sample (O) Mean (M) Deviation (|O/STDEV|)
(STDEV)
brand association -> .177 .173 .045 3.952 .000
consumer purchase
intention
brand awareness -> -.345 -.333 .040 8.688 .000
consumer purchase
intention
brand loyalty -> consumer .511 .507 .040 12.937 .000
purchase intention
perceived quality -> .168 .177 .048 3.507 .000
consumer purchase
intention
117