
Page 329 - MARSIUM'21 COMP OF PAPER
P. 329
Jamy Ong & Adaviah (2022)
3.4. Data Analysis
Table 3.1: Methods Used in this Research
■ 4.0 DATA ANALYSIS PLAN
4.1 Response Rate
The sample of this research was decided by implementing Tabachnick and Fidell calculation (2007) where the
minimum sample of respondents for this research is 135 respondents as stated in Chapter 3. According to Research Info (1998),
the good survey response for an online survey is above 20%. For customer satisfaction research, the response rates in the
survey would be the range of 10% to 30% range. The response rate in this survey is 20% where there are 180 respondents
answered the questionnaire. Hence, the response rate in this research is considered acceptable. An outlier analysis was utilized
to spot and eliminate the extreme value from the dataset (Grubbs, 1969). The result shown that one set of questionnaires need
to be eliminated from the dataset. Table 4.1 as below shows the research’s sample size, data collected that can be used in this
research and the response rate of this research.
Table 4.1 Response Rate of the research
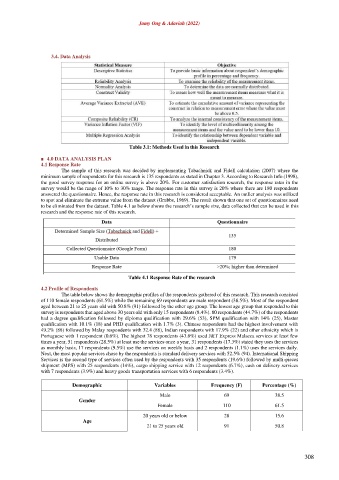
4.2 Profile of Respondents
The table below shows the demographic profiles of the respondents gathered of this research. This research consisted
of 110 female respondents (61.5%) while the remaining 69 respondents are male respondent (38.5%). Most of the respondent
aged between 21 to 25 years old with 50.8% (91) followed by the other age group. The lowest age group that responded to this
survey is respondents that aged above 30 years old with only 15 respondents (8.4%). 80 respondents (44.7%) of the respondents
had a degree qualification followed by diploma qualification with 29.6% (53), SPM qualification with 14% (25), Master
qualification with 10.1% (18) and PHD qualification with 1.7% (3). Chinese respondents had the highest involvement with
49.2% (88) followed by Malay respondents with 32.4 (88), Indian respondents with 17.9% (22) and other ethnicity which is
Portuguese with 1 respondent (0.6%). The highest 78 respondents (43.6%) used J&T Express Malacca services at least few
times a year, 51 respondents (28.5%) at least use the services once a year, 31 respondents (17.3%) stated they uses the services
as monthly basis, 17 respondents (9.5%) use the services on weekly basis and 2 respondents (1.1%) uses the services daily.
Next, the most popular services chose by the respondents is standard delivery services with 52.5% (94). International Shipping
Services is the second type of services often used by the respondents with 35 respondents (19.6%) followed by multi-pieces
shipment (MPS) with 25 respondents (14%), cargo shipping service with 12 respondents (6.7%), cash on delivery services
with 7 respondents (3.9%) and heavy goods transportation services with 6 respondents (3.4%).
Demographic Variables Frequency (F) Percentage (%)
Male 69 38.5
Gender
Female 110 61.5
20 years old or below 28 15.6
Age
21 to 25 years old 91 50.8
308