
Page 333 - MARSIUM'21 COMP OF PAPER
P. 333
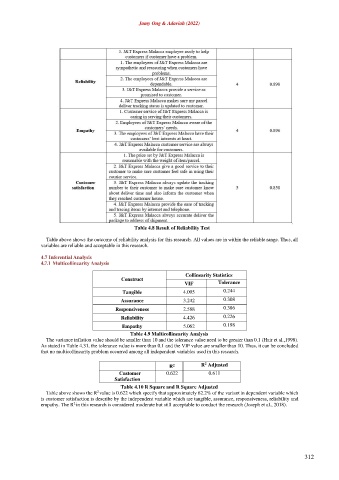
Jamy Ong & Adaviah (2022)


                                                Table 4.8 Result of Reliability Test

                 Table above shows the outcome of reliability analysis for this research. All values are in within the reliable range. Thus, all
               variables are reliable and acceptable in this research.

               4.7 Inferential Analysis
               4.7.1 Multicollinearity Analysis

                                                                  Collinearity Statistics
                                            Construct
                                                                  VIF         Tolerance
                                            Tangible             4.095          0.244
                                           Assurance             3.242          0.308
                                          Responsiveness         2.588          0.386
                                           Reliability           4.426          0.226
                                            Empathy              5.062          0.198
                                               Table 4.9 Multicollinearity Analysis
                 The variance inflation value should be smaller than 10 and the tolerance value need to be greater than 0.1 (Hair et al.,1998).
               As stated in Table 4.31, the tolerance value is more than 0.1 and the VIF value are smaller than 10. Thus, it can be concluded
               that no multicollinearity problem occurred among all independent variables used in this research.

                                                                         2
                                                             R 2        R  Adjusted
                                           Customer        0.622          0.611
                                         Satisfaction
                                           Table 4.10 R Square and R Square Adjusted
                                   2
                 Table above shows the R  value is 0.622 which specify that approximately 62.2% of the variant in dependent variable which
               is customer satisfaction is describe by the independent variable which are tangible, assurance, responsiveness, reliability and
                           2
               empathy. The R  in this research is considered moderate but still acceptable to conduct the research (Joseph et al., 2018).


                                                                                                            312