
Page 331 - MARSIUM'21 COMP OF PAPER
P. 331
Jamy Ong & Adaviah (2022)
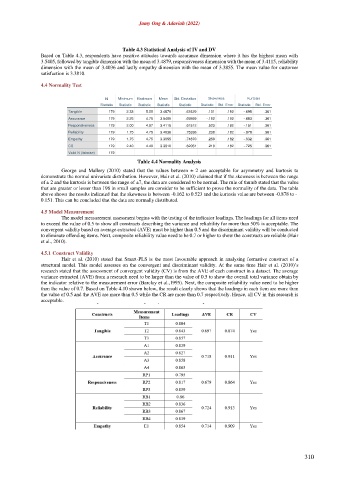
Table 4.3 Statistical Analysis of IV and DV
Based on Table 4.3, respondents have positive attitudes towards assurance dimension where it has the highest mean with
3.5405, followed by tangible dimension with the mean of 3.4879, responsiveness dimension with the mean of 3.4115, reliability
dimension with the mean of 3.4036 and lastly empathy dimension with the mean of 3.3855. The mean value for customer
satisfaction is 3.3810.
4.4 Normality Test
N Minimum Maximum Mean Std. Deviation Skewness Kurtosis
Statistic Statistic Statistic Statistic Statistic Statistic Std. Error Statistic Std. Error
Tangible 179 2.33 5.00 3.4879 .63429 .101 .182 -.695 .361
Assurance 179 2.25 4.75 3.5405 .69869 -.162 .182 -.683 .361
Responsiveness 179 2.00 4.67 3.4115 .61512 .523 .182 -.151 .361
Reliability 179 1.75 4.75 3.4036 .75336 .238 .182 -.878 .361
Empathy 179 1.75 4.75 3.3855 .74870 .259 .182 -.832 .361
CS 179 2.40 4.40 3.3810 .62051 .219 .182 -.725 .361
Valid N (listwise) 179
Table 4.4 Normality Analysis
George and Mallery (2010) stated that the values between ± 2 are acceptable for asymmetry and kurtosis to
demonstrate the normal univariate distribution. However, Hair et al. (2010) claimed that if the skewness is between the range
of ± 2 and the kurtosis is between the range of ±7, the data are considered to be normal. The rule of thumb stated that the value
that are greater or lesser than 196 in small samples are consider to be sufficient to prove the normality of the data. The table
above shows the results indicated that the skewness is between -0.162 to 0.523 and the kurtosis value are between -0.878 to -
0.151. This can be concluded that the data are normally distributed.
4.5 Model Measurement
The model measurement assessment begins with the testing of the indicator loadings. The loadings for all items need
to exceed the value of 0.5 to show all constructs describing the variance and reliability for more than 50% is acceptable. The
convergent validity based on average extracted (AVE) must be higher than 0.5 and the discriminant validity will be conducted
to eliminate offending items. Next, composite reliability value need to be 0.7 or higher to show the constructs are reliable (Hair
et al., 2010).
4.5.1 Construct Validity
Hair et al. (2010) stated that Smart-PLS is the most favourable approach in analysing formative construct of a
structural model. This model assesses on the convergent and discriminant validity. At the same time Hair et al. (2010)’s
research stated that the assessment of convergent validity (CV) is from the AVE of each construct in a dataset. The average
variance extracted (AVE) from a research need to be larger than the value of 0.5 to show the overall total variance obtain by
the indicator relative to the measurement error (Barclay et al.,1995). Next, the composite reliability value need to be higher
than the value of 0.7. Based on Table 4.10 shown below, the result clearly shows that the loadings in each item are more than
the value of 0.5 and the AVE are more than 0.5 while the CR are more than 0.7 respectively. Hence, all CV in this research is
acceptable.
310