
Page 332 - MARSIUM'21 COMP OF PAPER
P. 332
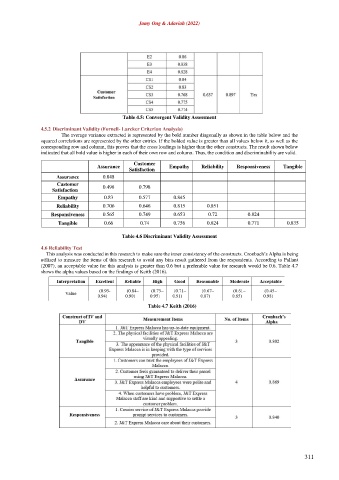
Jamy Ong & Adaviah (2022)


                                            Table 4.5: Convergent Validity Assessment

               4.5.2 Discriminant Validity (Fornell- Larcker Criterion Analysis)
                       The average variance extracted is represented by the bold number diagonally as shown in the table below and the
               squared correlations are represented by the other entries. If the bolded value is greater than all values below it, as well as the
               corresponding row and column, this proves that the cross loadings is higher than the other constructs. The result shown below
               indicated that all bold value is higher in each of their own row and column. Thus, the condition and discriminability are valid.

                                                Customer
                                   Assurance                Empathy     Reliability   Responsiveness   Tangible
                                              Satisfaction
                     Assurance       0.848
                     Customer
                   Satisfaction      0.498        0.798
                     Empathy          0.83        0.577       0.845
                     Reliability     0.706        0.646       0.815       0.851
                   Responsiveness    0.565        0.749       0.653       0.72          0.824
                     Tangible         0.66        0.74        0.756       0.824         0.771         0.835

                                            Table 4.6 Discriminant Validity Assessment

               4.6 Reliability Test
                 This analysis was conducted in this research to make sure the inner consistency of the constructs. Cronbach’s Alpha is being
               utilized to measure the items of this research to avoid any bias result gathered from the respondents. According to Pallant
               (2007), an acceptable value for this analysis is greater than 0.6 but a preferable value for research would be 0.6. Table 4.7
               shows the alpha values based on the findings of Keith (2016).


                                                     Table 4.7 Keith (2016)


                                                                                                            311