
Page 328 - MARSIUM'21 COMP OF PAPER
P. 328
Jamy Ong & Adaviah (2022)
score the degree of satisfaction with a variety of service quality dimension. Crompton et al. (1991) expressed that there was a
lot of ambiguity in the satisfaction and service quality literature as researcher supposed to evaluate satisfaction instead of
evaluating service quality. Thus, researcher begin investigating the relationship of service quality towards customer satisfaction
and both entities were separated into dependent and independent variable of a research (Tian-Cole, Crompton, & Wilson,
2002).
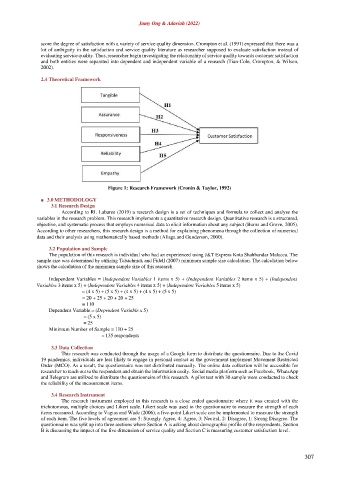
2.4 Theoretical Framework
Figure 1: Research Framework (Cronin & Taylor, 1992)
■ 3.0 METHODOLOGY
3.1 Research Design
According to RL Labaree (2019) a research design is a set of techniques and formula to collect and analyse the
variables in the research problem. This research implements a quantitative research design. Quantitative research is a structured,
objective, and systematic process that employs numerical data to elicit information about any subject (Burns and Grove, 2005).
According to other researchers, this research design is a method for explaining phenomena through the collection of numerical
data and their analysis using mathematically based methods (Aliaga and Gunderson, 2000).
3.2 Population and Sample
The population of this research is individual who had an experienced using J&T Express Kota Shahbandar Malacca. The
sample size was determined by utilizing Tabachnick and Fidell (2007) minimum sample size calculation. The calculation below
shows the calculation of the minimum sample size of this research.
Independent Variables = (Independent Variables 1 items x 5) + (Independent Variables 2 items x 5) + (Independent
Variables 3 items x 5) + (Independent Variables 4 items x 5) + (Independent Variables 5 items x 5)
= (4 x 5) + (5 x 5) + (4 x 5) + (4 x 5) + (5 x 5)
= 20 + 25 + 20 + 20 + 25
= 110
Dependent Variable = (Dependent Variable x 5)
= (5 x 5)
= 25
Minimum Number of Sample = 110 + 25
= 135 respondents
3.3 Data Collection
This research was conducted through the usage of a Google form to distribute the questionnaire. Due to the Covid
19 pandemics, individuals are less likely to engage in personal contact as the government implement Movement Restricted
Order (MCO). As a result, the questionnaire was not distributed manually. The online data collection will be accessible for
researcher to reach out to the respondent and obtain the information easily. Social media platform such as Facebook, WhatsApp
and Telegram are utilized to distribute the questionnaire of this research. A pilot test with 30 sample were conducted to check
the reliability of the measurement items.
3.4 Research Instrument
The research instrument employed in this research is a close ended questionnaire where it was created with the
trichotomous, multiple choices and Likert scale. Likert scale was used in the questionnaire to measure the strength of each
items measured. According to Vagias and Wade (2006), a five-point Likert scale can be implemented to measure the strength
of each item. The five levels of agreement are 5: Strongly Agree, 4: Agree, 3: Neutral, 2: Disagree, 1: Strong Disagree. The
questionnaire was split up into three sections where Section A is asking about demographic profile of the respondents, Section
B is discussing the impact of the five dimension of service quality and Section C is measuring customer satisfaction level.
307