
Page 378 - MARSIUM'21 COMP OF PAPER
P. 378
357 Leon (2021)
3.3 DATA COLLECTION
The questionnaire will be distributed to the respondents by using systematic sampling for Instagram followers whereas convenience sampling
for its visitors. For systematic sampling, the samples are selected by selecting a random starting point, and then continuously selecting each
ith element from the sampling frame. (Note: ith is the sampling interval, is being determined by dividing the population size, N by the sample
size, n and rounding to the nearest integer). In this study, there are 511 elements in the population and a sample of 170 is desired. A random
number between 1 and 250 is selected. If, for example, this number is 1, all the samples consist of elements 1, 11, 12, 13, 14, 15, and so
on. 250 questionnaires will be distributed among followers of Instagram in Nancy's kitchen through private chat by online Google Forms.
Nevertheless, due to the low return of feedback, another approach is being carried out which is a convenient approach, asking the visitor who
comes on-site to fill in the survey form.
3.4 RESEARCH INSTRUMENT
The use of a quantitative approach was considered most suitable for this study. The questionnaire can be divided into two main parts. Part
A consists of 9 questions asking for respondents’ demographic profile. Part B consists of 33 questions mainly to answer the independent
variables (IV) and dependent variables (DV). There are 18 questions on visual effects, 12 questions on exposure effects and 3 questions from
visitors’ intention towards restaurant selection. The set of questionnaires are asking the respondents to tick from the given selection. Five
points Likert scale is to determine the strength of the answer with levels of agreement such as ‘1 = strongly disagree’, ‘2 = disagree’, ‘3 =
neutral’, ‘4 = agree’, and ‘5 = strongly agree’.
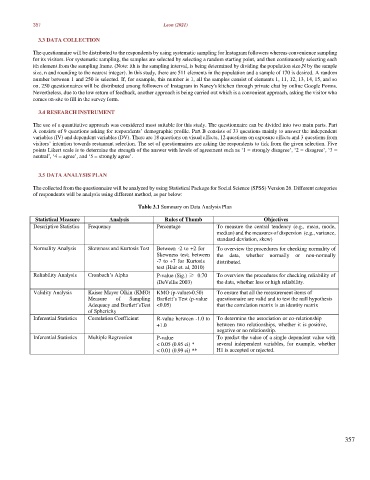
3.5 DATA ANALYSIS PLAN
The collected from the questionnaire will be analyzed by using Statistical Package for Social Science (SPSS) Version 26. Different categories
of respondents will be analysis using different method, as per below:
Table 3.1 Summary on Data Analysis Plan
Statistical Measure Analysis Rules of Thumb Objectives
Descriptive Statistics Frequency Percentage To measure the central tendency (e.g., mean, mode,
median) and the measures of dispersion (e.g., variance,
standard deviation, skew)
Normality Analysis Skewness and Kurtosis Test Between -2 to +2 for To overview the procedures for checking normality of
Skewness test; between the data, whether normally or non-normally
-7 to +7 for Kurtosis distributed.
test (Hair et. al, 2010)
Reliability Analysis Cronbach’s Alpha P-value (Sig.) ≥ 0.70 To overview the procedures for checking reliability of
(DeVellis 2003) the data, whether less or high reliability.
Validity Analysis Kaiser Mayer Olkin (KMO) KMO (p-value>0.50) To ensure that all the measurement items of
Measure of Sampling Bartlett’s Test (p-value questionnaire are valid and to test the null hypothesis
Adequacy and Bartlett’s Test <0.05) that the correlation matrix is an identity matrix
of Sphericity
Inferential Statistics Correlation Coefficient R-value between -1.0 to To determine the association or co-relationship
+1.0 between two relationships, whether it is positive,
negative or no relationship.
Inferential Statistics Multiple Regression P-value To predict the value of a single dependent value with
< 0.05 (0.95 ci) * several independent variables, for example, whether
< 0.01 (0.99 ci) ** H1 is accepted or rejected.
357