
Page 382 - MARSIUM'21 COMP OF PAPER
P. 382
361 Leon (2021)
EBA3 I feel the restaurant is different from others.
EBA4 How likely are you to revisit the restaurant?
EBA5 How likely are you to recommend the restaurant to your friends?
EBA6 How likely are you to be willing to share the restaurant photo or posts?
VISIT INTENTIONS
After browsing its Instagram profile, …
VI1 I plan to visit Nancy’s Kitchen. 0.812
VI2 I truly want to visit Nancy’s Kitchen.
VI3 I have higher intention of visiting Nancy's Kitchen compared to other restaurants.
4.6 Validity Analysis
To ensure that all the measurement items of the questionnaire are valid in this study, a validity test is required. Kaiser Mayer Olkin (KMO)
Measure of Sampling Adequacy and Bartlett’s Test of Sphericity were implemented for validity analysis. KMO is conducted to examine the
strength of the partial correlation between the variables. The closer the KMO values, the more ideal for the data validation. If the KMO value
is less than 0.50. From the result of Table 4.5, the KMO value is 0.804 (>0.50) representing a strong partial correlation among the variables.
For Bartlett’s test of Sphericity, it is used to test the null hypothesis that the correlation matrix is an identity matrix. It is not an ideal factor
of analysis if the correlation matrix is identity which means the variables are unrelated. The value of a significant statistical test from the
study is 0.00 (<0.05) which shows that the correlation matrix is not an identity matrix (rejection of the null hypothesis).
Table 4.6 KMO and Bartlett’s Test
Kaiser-Meyer-Olkin Measure of Sampling Adequacy. .804
Bartlett's Test of Sphericity Approx. Chi-Square 524.163
df 15
Sig. .000
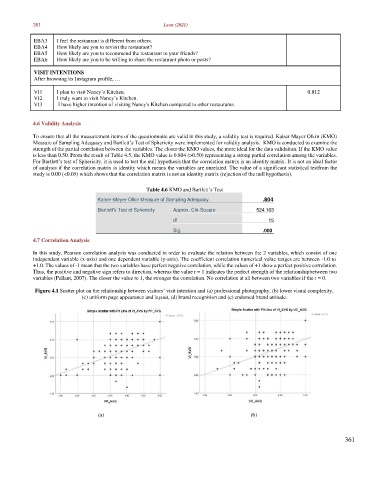
4.7 Correlation Analysis
In this study, Pearson correlation analysis was conducted in order to evaluate the relation between the 2 variables, which consist of one
independent variable (x-axis) and one dependent variable (y-axis). The coefficient correlation numerical value ranges are between -1.0 to
+1.0. The values of -1 mean that the two variables have perfect negative correlation, while the values of +1 show a perfect positive correlation.
Thus, the positive and negative sign refers to direction, whereas the value r = 1 indicates the perfect strength of the relationship between two
variables (Pallant, 2007). The closer the value to 1, the stronger the correlation. No correlation at all between two variables if the r = 0.
Figure 4.1 Scatter plot on the relationship between visitors’ visit intention and (a) professional photography, (b) lower visual complexity,
(c) uniform page appearance and layout, (d) brand recognition and (e) endorsed brand attitude.
(a) (b)
361