Page 383 - MARSIUM'21 COMP OF PAPER
P. 383

362                                        Leon (2021)


                                  (c)                                               (d)


                                                             (e)

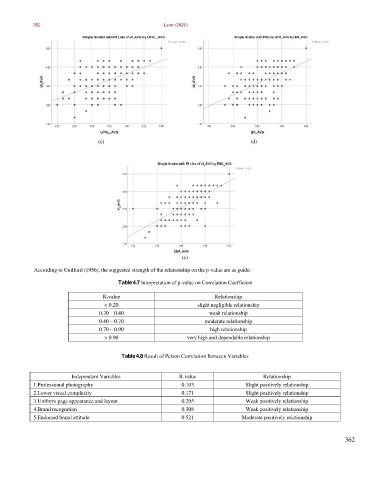
            According to Guilford (1956), the suggested strength of the relationship on the p-value are as guide:

                                        Table 4.7 Interpretation of p-value on Correlation Coefficient

                                   R-value                              Relationship
                                    < 0.20                        slight negligible relationship
                                  0.20 – 0.40                         weak relationship
                                  0.40 – 0.70                        moderate relationship
                                  0.70 – 0.90                          high relationship
                                    > 0.90                     very high and dependable relationship


                                         Table 4.8 Result of Person Correlation Between Variables


                         Independent Variables              R-value                     Relationship
            1.Professional photography                       0.193                Slight positively relationship
            2.Lower visual complexity                        0.171                Slight positively relationship
            3.Uniform page appearance and layout             0.295                Weak positively relationship
            4.Brand recognition                              0.308                Weak positively relationship
            5.Endorsed brand attitude                        0.521               Moderate positively relationship


                                                                                                                   362
   378   379   380   381   382   383   384   385   386   387   388