
Page 380 - MARSIUM'21 COMP OF PAPER
P. 380
359 Leon (2021)
2 – 3 hours 65 38
3 – 4 hours 32 18.7
More than 4 hours 18 10.5
How many times have you visited the restaurant? 0 - 1 29 28.7
2 - 3 68 39.8
4 - 5 45 26.3
More than 5 times 9 5.3
What is the average expenditure on each visit? RM 15 and below 21 12.3
RM16 – RM 30 40 23.4
RM 31 – RM 70 46 26.9
RM 71 – RM 100 45 26.3
RM 101 and above 19 11.1
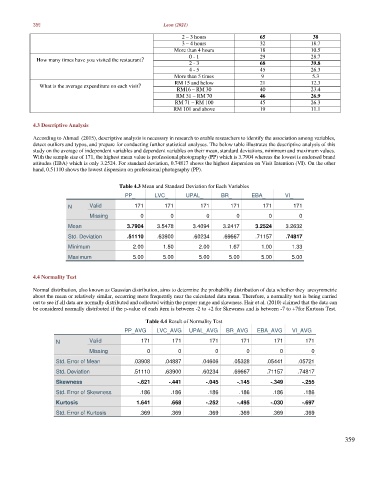
4.3 Descriptive Analysis
According to Ahmad (2015), descriptive analysis is necessary in research to enable researchers to identify the association among variables,
detect outliers and typos, and prepare for conducting further statistical analyses. The below table illustrates the descriptive analysis of this
study on the average of independent variables and dependent variables on their mean, standard deviations, minimum and maximum values.
With the sample size of 171, the highest mean value is professional photography (PP) which is 3.7904 whereas the lowest is endorsed brand
attitudes (EBA) which is only 3.2524. For standard deviation, 0.74817 shows the highest dispersion on Visit Intention (VI). On the other
hand, 0.51110 shows the lowest dispersion on professional photography (PP).
Table 4.3 Mean and Standard Deviation for Each Variables
PP_ LVC_ UPAL_ BR_ EBA_ VI_
N Valid 171 171 171 171 171 171
Missing 0 0 0 0 0 0
Mean 3.7904 3.5478 3.4094 3.2417 3.2524 3.2632
Std. Deviation .51110 .63900 .60234 .69667 .71157 .74817
Minimum 2.00 1.50 2.00 1.67 1.00 1.33
Maximum 5.00 5.00 5.00 5.00 5.00 5.00
4.4 Normality Test
Normal distribution, also known as Gaussian distribution, aims to determine the probability distribution of data whether they are symmetric
about the mean or relatively similar, occurring more frequently near the calculated data mean. Therefore, a normality test is being carried
out to see if all data are normally distributed and collected within the proper range and skewness. Hair et al. (2010) claimed that the data can
be considered normally distributed if the p-value of each item is between -2 to +2 for Skewness and is between -7 to +7 for Kurtosis Test.
Table 4.4 Result of Normality Test
PP_AVG LVC_AVG UPAL_AVG BR_AVG EBA_AVG VI_AVG
N Valid 171 171 171 171 171 171
Missing 0 0 0 0 0 0
Std. Error of Mean .03908 .04887 .04606 .05328 .05441 .05721
Std. Deviation .51110 .63900 .60234 .69667 .71157 .74817
Skewness -.621 -.441 -.045 -.145 -.349 -.255
Std. Error of Skewness .186 .186 .186 .186 .186 .186
Kurtosis 1.641 .668 -.252 -.495 -.030 -.697
Std. Error of Kurtosis .369 .369 .369 .369 .369 .369
359