
Page 379 - MARSIUM'21 COMP OF PAPER
P. 379
358 Leon (2021)
4.0 DATA ANALYSIS
4.1 RESPONSE RATE
The study had fulfilled the minimum sample size required that is 100 respondents based on the calculation stated in Chapter 3.2 with the
sample-to-variable ratio 1:20. A total of 250 questionnaires were distributed to Nancy’s Kitchen Instagram followers and visitors. From a
total of 250 distributed questionnaires, 171 were successfully returned of 68.4%. According to Richardson (2005), the acceptable response
rate for a study is greater than 50% but achieving 60% and above will be more desirable. Table below summarizing the response rate of the
study.
Table 4.1 Summary of Response Rate
Type Questionnaire Distributed Number of Response Percentage of Response Rate
Google Form 250 171 68.4%
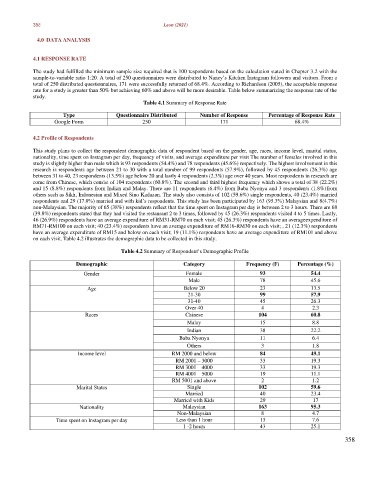
4.2 Profile of Respondents
This study plans to collect the respondent demographic data of respondent based on the gender, age, races, income level, marital status,
nationality, time spent on Instagram per day, frequency of visits, and average expenditure per visit The number of females involved in this
study is slightly higher than male which is 93 respondents (54.4%) and 78 respondents (45.6%) respectively. The highest involvement in this
research is respondents age between 21 to 30 with a total number of 99 respondents (57.9%), followed by 45 respondents (26.3%) age
between 31 to 40, 23 respondents (13.5%) age below 20 and lastly 4 respondents (2.3%) age over 40 years. Most respondents in research are
come from Chinese, which consist of 104 respondents (60.8%). The second and third highest frequency which shows a total of 38 (22.2%)
and 15 (8.8%) respondents from Indian and Malay. There are 11 respondents (6.4%) from Baba Nyonya and 3 respondents (1.8%) from
others such as Sikh, Indonesian and Mixed Sino Kadazan. The study also consists of 102 (59.6%) single respondents, 40 (23.4%) married
respondents and 29 (17.0%) married and with kid’s respondents. This study has been participated by 163 (95.3%) Malaysian and 8 (4.7%)
non-Malaysian. The majority of 65 (38%) respondents reflect that the time spent on Instagram per day is between 2 to 3 hours. There are 68
(39.8%) respondents stated that they had visited the restaurant 2 to 3 times, followed by 45 (26.3%) respondents visited 4 to 5 times. Lastly,
46 (26.9%) respondents have an average expenditure of RM31-RM70 on each visit; 45 (26.3%) respondents have an average expenditure of
RM71-RM100 on each visit; 40 (23.4%) respondents have an average expenditure of RM16-RM30 on each visit; , 21 (12.3%) respondents
have an average expenditure of RM15 and below on each visit; 19 (11.1%) respondents have an average expenditure of RM101 and above
on each visit. Table 4.2 illustrates the demographic data to be collected in this study.
Table 4.2 Summary of Respondent’s Demographic Profile
Demographic Category Frequency (F) Percentage (%)
Gender Female 93 54.4
Male 78 45.6
Age Below 20 23 13.5
21-30 99 57.9
31-40 45 26.3
Over 40 4 2.3
Races Chinese 104 60.8
Malay 15 8.8
Indian 38 22.2
Baba Nyonya 11 6.4
Others 3 1.8
Income level RM 2000 and below 84 49.1
RM 2001 – 3000 33 19.3
RM 3001 – 4000 33 19.3
RM 4001 – 5000 19 11.1
RM 5001 and above 2 1.2
Marital Status Single 102 59.6
Married 40 23.4
Married with Kids 29 17
Nationality Malaysian 163 95.3
Non-Malaysian 8 4.7
Time spent on Instagram per day Less than 1 hour 13 7.6
1 -2 hours 43 25.1
358