
Page 463 - MARSIUM'21 COMP OF PAPER
P. 463
Muhamad Rifqi Zafran Bin Abdul Hakim (2022)
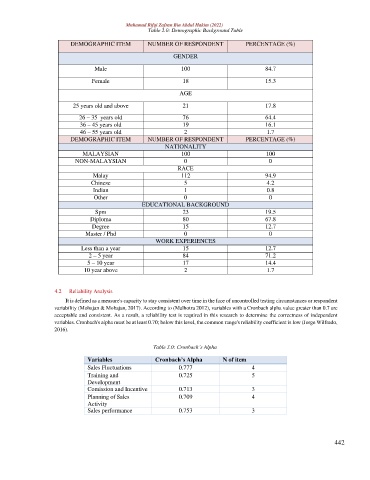
Table 2.0: Demographic Background Table
DEMOGRAPHIC ITEM NUMBER OF RESPONDENT PERCENTAGE (%)
GENDER
Male 100 84.7
Female 18 15.3
AGE
25 years old and above 21 17.8
26 – 35 years old 76 64.4
36 – 45 years old 19 16.1
46 – 55 years old 2 1.7
DEMOGRAPHIC ITEM NUMBER OF RESPONDENT PERCENTAGE (%)
NATIONALITY
MALAYSIAN 100 100
NON-MALAYSIAN 0 0
RACE
Malay 112 94.9
Chinese 5 4.2
Indian 1 0.8
Other 0 0
EDUCATIONAL BACKGROUND
Spm 23 19.5
Diploma 80 67.8
Degree 15 12.7
Master / Phd 0 0
WORK EXPERIENCES
Less than a year 15 12.7
2 – 5 year 84 71.2
5 – 10 year 17 14.4
10 year above 2 1.7
4.2 Reliability Analysis
It is defined as a measure's capacity to stay consistent over time in the face of uncontrolled testing circumstances or respondent
variability (Mohajan & Mohajan, 2017). According to (Malhotra 2012), variables with a Cronbach alpha value greater than 0.7 are
acceptable and consistent. As a result, a reliability test is required in this research to determine the correctness of independent
variables. Cronbach's alpha must be at least 0.70; below this level, the common range's reliability coefficient is low (Jorge Wilfredo,
2016).
Table 3.0: Cronbach’s Alpha
Variables Cronbach’s Alpha N of item
Sales Fluctuations 0.777 4
Training and 0.725 5
Development
Comission and Incentive 0.713 3
Planning of Sales 0.709 4
Activity
Sales performance 0.753 3
442