
Page 466 - MARSIUM'21 COMP OF PAPER
P. 466
Muhamad Rifqi Zafran Bin Abdul Hakim (2022)
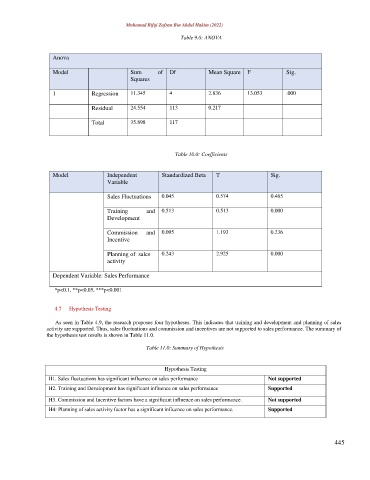
Table 9.0: ANOVA
Anova
Model Sum of Df Mean Square F Sig.
Squares
1 Regression 11.345 4 2.836 13.053 .000
Residual 24.554 113 0.217
Total 35.898 117
Table 10.0: Coefficients
Model Independent Standardized Beta T Sig.
Variable
Sales Fluctuations 0.045 0.574 0.465
Training and 0.513 0.513 0.000
Development
Commission and 0.095 1.193 0.236
Incentive
Planning of sales 0.243 2.925 0.000
activity
Dependent Variable: Sales Performance
*p<0.1, **p<0.05, ***p<0.001
4.7 Hypothesis Testing
As seen in Table 4.9, the research proposes four hypotheses. This indicates that training and development and planning of sales
activity are supported. Thus, sales fluctuations and commission and incentives are not supported to sales performance. The summary of
the hypothesis test results is shown in Table 11.0.
Table 11.0: Summary of Hypothesis
Hypothesis Testing
H1. Sales fluctuations has significant influence on sales performance Not supported
H2. Training and Development has significant influence on sales performance Supported
H3. Commission and Incentive factors have a significant influence on sales performance. Not supported
H4: Planning of sales activity factor has a significant influence on sales performance. Supported
445