
Page 464 - MARSIUM'21 COMP OF PAPER
P. 464
Muhamad Rifqi Zafran Bin Abdul Hakim (2022)
4.3 Normality Analysis
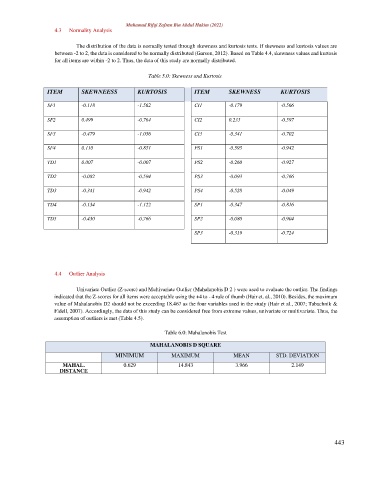
The distribution of the data is normally tested through skewness and kurtosis tests. If skewness and kurtosis values are
between -2 to 2, the data is considered to be normally distributed (Garson, 2012). Based on Table 4.4, skewness values and kurtosis
for all items are within -2 to 2. Thus, the data of this study are normally distributed.
Table 5.0: Skewness and Kurtosis
ITEM SKEWNEESS KURTOSIS ITEM SKEWNESS KURTOSIS
SF1 -0.118 -1.562 CI1 -0.179 -0.566
SF2 0.499 -0.764 CI2 0.233 -0.597
SF3 -0.479 -1.056 CI3 -0.341 -0.702
SF4 0.110 -0.851 PS1 -0.595 -0.942
TD1 0.007 -0.007 PS2 -0.260 -0.927
TD2 -0.082 -0.594 PS3 -0.093 -0.766
TD3 -0.341 -0.942 PS4 -0.528 -0.049
TD4 -0.134 -1.122 SP1 -0.347 -0.816
TD5 -0.430 -0.766 SP2 -0.080 -0.904
SP3 -0.319 -0.724
4.4 Outlier Analysis
Univariate Outlier (Z-score) and Multivariate Outlier (Mahalanobis D 2 ) were used to evaluate the outlier. The findings
indicated that the Z-scores for all items were acceptable using the +4 to - 4 rule of thumb (Hair et. al., 2010). Besides, the maximum
value of Mahalanobis D2 should not be exceeding 18.467 as the four variables used in the study (Hair et al., 2007; Tabachnik &
Fidell, 2007). Accordingly, the data of this study can be considered free from extreme values, univariate or multivariate. Thus, the
assumption of outliers is met (Table 4.5).
Table 6.0: Mahalanobis Test
MAHALANOBIS D SQUARE
MINIMUM MAXIMUM MEAN STD. DEVIATION
MAHAL. 0.629 14.843 3.966 2.149
DISTANCE
443