
Page 465 - MARSIUM'21 COMP OF PAPER
P. 465
Muhamad Rifqi Zafran Bin Abdul Hakim (2022)
4.5 Multicollinearity Analysis
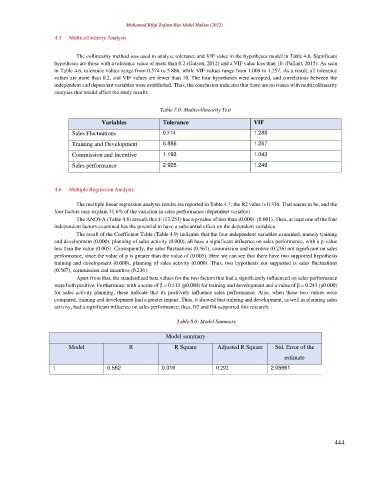
The collinearity method was used to analyze tolerance and VIF value in the hypotheses model in Table 4.6. Significant
hypotheses are those with a tolerance value of more than 0.2 (Garson, 2012) and a VIF value less than 10. (Pallant, 2015). As seen
in Table 4.6, tolerance values range from 0.574 to 5.886, while VIF values range from 1.008 to 1.257. As a result, all tolerance
values are more than 0.2, and VIF values are fewer than 10. The four hypotheses were accepted, and correlations between the
independent and dependent variables were established. Thus, the conclusion indicates that there are no issues with multicollinearity
analyses that would affect the study results.
Table 7.0: Multicollinearity Test
Variables Tolerance VIF
Sales Fluctuations 0.574 1.288
Training and Development 5.886 1.257
Commission and Incentive 1.193 1.043
Sales performance 2.925 1.249
4.6 Multiple Regression Analysis
The multiple linear regression analysis results are reported in Table 4.7; the R2 value is 0.316. That seems to be, and the
four factors may explain 31.6% of the variation in sales performance (dependent variable).
The ANOVA (Table 4.8) reveals that F (13.253) has a p-value of less than (0.000). (0.001). Thus, at least one of the four
independent factors examined has the potential to have a substantial effect on the dependent variables.
The result of the Coefficient Table (Table 4.9) indicates that the four independent variables examined, namely training
and development (0.000), planning of sales activity (0.000), all have a significant influence on sales performance, with a p-value
less than the value (0.005). Consequently, the sales fluctuations (0.567), commission and incentive (0.236) not significant on sales
performance, since the value of p is greater than the value of (0.005). Here we can see that there have two supported hypothesis
training and development (0.000), planning of sales activity (0.000). Thus, two hypothesis not supported is sales fluctuations
(0.567), commission and incentive (0.236).
Apart from that, the standardized beta values for the two factors that had a significantly influenced on sales performance
were both positive. Furthermore, with a score of β = 0.513 (p0.000) for training and development and a value of β = 0.243 (p0.000)
for sales activity planning, these indicate that its positively influence sales performance. Also, when these two values were
compared, training and development had a greater impact. Thus, it showed that training and development, as well as planning sales
activity, had a significant influence on sales performance; thus, H2 and H4 supported this research.
Table 8.0: Model Summary
Model summary
Model R R Square Adjusted R Square Std. Error of the
estimate
1 0.562 0.316 0.292 2.05661
444