
Page 490 - MARSIUM'21 COMP OF PAPER
P. 490
Muhammad Amirul Asraf Bin Sungip (2022)
purchase intention is a positive relationship and purchase behavior of consumer can be predicted effectively form the
consumer’s purchase intention [Dodds et al. (1991); Parasuraman and Grewal (2000)]. It is argued by Kukar-Kinney et al.
(2012) that the purchase intention of consumers on a product or a service will increase when the perceived quality and
perceived value of that particular product or service is high. Therefore, perceived value and purchase intention is found to
be positively correlated. Thus, the following hypothesis is proposed. Henceforth,
H3: Perceived value of consumer has positive influence on purchase intention toward workers’ dormitory service
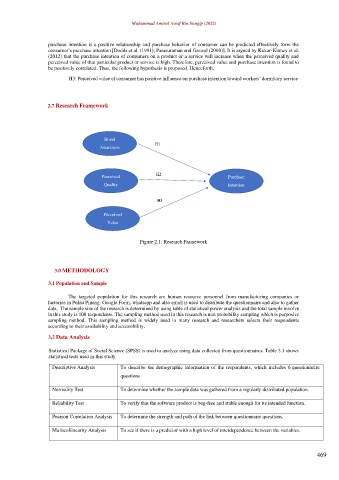
2.7 Research Framework
Brand
Awareness
Perceived Purchase
Quality Intention
Perceived
Value
Figure 2.1: Research Framework
3.0 METHODOLOGY
3.1 Population and Sample
The targeted population for this research are human resource personnel from manufacturing companies or
factories in Pulau Pinang. Google Form, whatsapp and also email is used to distribute the questionnaire and also to gather
data. The sample size of the research is determined by using table of statistical power analysis and the total sample involve
in this study is 108 respondents. The sampling method used in this research is non probability sampling which is purposive
sampling method. This sampling method is widely used in many research and researchers selects their respondents
according to their availability and accessibility.
3.2 Data Analysis
Statistical Package of Social Science (SPSS) is used to analyze using data collected from questionnaires. Table 3.1 shows
statistical tests used in this study.
Descriptive Analysis To describe the demographic information of the respondents, which includes 6 questionnaire
questions
Normality Test To determine whether the sample data was gathered from a regularly distributed population.
Reliability Test To verify that the software product is bug-free and stable enough for its intended function.
Pearson Correlation Analysis To determine the strength and path of the link between questionnaire questions.
Multicollinearity Analysis To see if there is a predictor with a high level of interdependence between the variables.
469