Page 491 - MARSIUM'21 COMP OF PAPER
P. 491

Muhammad Amirul Asraf Bin Sungip (2022)


                   Outlier Analysis        To detect outliers from the respondents' replies to each question item
                   Multiple Regression Analysis   Determining the importance of the independent variable in relation to the dependent variable

                                                Table 3.1: Statistical Test used in SPSS


                    ■  4.0 RESEARCH FINDING

                  4.1 Respondents Profile

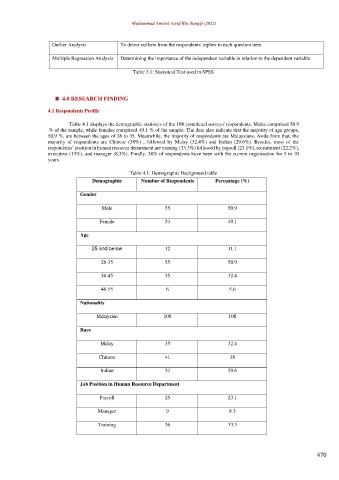
                         Table 4.1 displays the demographic statistics of the 108 completed surveys' respondents. Males comprised 50.9
                  % of the sample, while females comprised 49.1 % of the sample. The data also indicate that the majority of age groups,
                  50.9 %, are between the ages of 26 to 35. Meanwhile, the majority of respondents are Malaysians. Aside from that, the
                  majority  of  respondents  are  Chinese  (38%)  ,  followed  by  Malay  (32.4%)  and  Indian  (29.6%).  Besides,  most  of  the
                  respondents’ position in human resource department are training (33.3%) followed by payroll (23.1%), recruitment (22.2%),
                  executive (13%), and manager (8.3%). Finally, 38% of respondents have been with the current organisation for 5 to 10
                  years.

                                               Table 4.1: Demographic Background table
                                 Demographic       Number of Respondents     Percentage (%)

                             Gender

                                     Male                  55                    50.9

                                    Female                 53                    49.1

                             Age

                                 25 and below              12                    11.1

                                     26-35                 55                    50.9

                                     36-45                 35                    32.4

                                     46-55                 6                      5.6

                             Nationality

                                   Malaysian               108                   100

                             Race

                                    Malay                  35                    32.4

                                    Chinese                41                     38

                                    Indian                 32                    29.6

                             Job Position in Human Resource Department
                                    Payroll                25                    23.1


                                   Manager                 9                      8.3
                                    Training               36                    33.3


                                                                                                                470
   486   487   488   489   490   491   492   493   494   495   496