Page 493 - MARSIUM'21 COMP OF PAPER
P. 493

Muhammad Amirul Asraf Bin Sungip (2022)


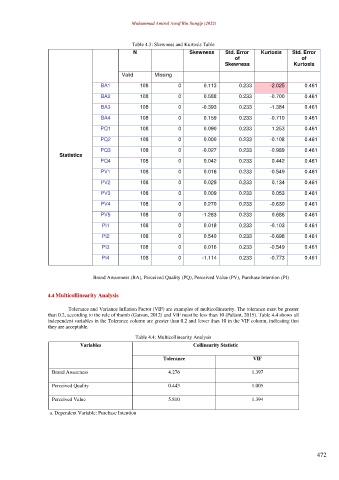
                                               Table 4.3: Skewness and Kurtosis Table
                                                N                   Skewness    Std. Error   Kurtosis   Std. Error
                                                                                    of                     of
                                                                                Skewness                Kurtosis
                                            Valid      Missing

                                    BA1           108           0        0.113       0.233      -2.025      0.461

                                    BA2           108           0        0.588       0.233      -0.700      0.461
                                    BA3           108           0       -0.393       0.233      -1.384      0.461

                                    BA4           108           0        0.159       0.233      -0.710      0.461

                                    PQ1           108           0        0.090       0.233       1.253      0.461
                                    PQ2           108           0        0.000       0.233      -0.108      0.461

                                    PQ3           108           0       -0.027       0.233      -0.989      0.461
                      Statistics
                                    PQ4           108           0        0.042       0.233       0.442      0.461
                                    PV1           108           0        0.016       0.233      -0.549      0.461
                                    PV2           108           0        0.029       0.233       0.134      0.461

                                    PV3           108           0        0.009       0.233       0.053      0.461
                                    PV4           108           0        0.270       0.233      -0.630      0.461
                                    PV5           108           0       -1.283       0.233       0.686      0.461

                                     PI1          108           0        0.018       0.233      -0.103      0.461
                                     PI2          108           0        0.540       0.233      -0.698      0.461

                                     PI3          108           0        0.016       0.233      -0.549      0.461
                                     PI4          108           0       -1.114       0.233      -0.773      0.461

                                  Brand Awareness (BA), Perceived Quality (PQ), Perceived Value (PV), Purchase Intention (PI)


                  4.4 Multicollinearity Analysis

                         Tolerance and Variance Inflation Factor (VIF) are examples of multicollinearity. The tolerance must be greater
                  than 0.2, according to the rule of thumb (Garson, 2012) and VIF must be less than 10 (Pallant, 2015). Table 4.4 shows all
                  independent variables in the Tolerance column are greater than 0.2 and fewer than 10 in the VIF column, indicating that
                  they are acceptable.
                                                 Table 4.4: Multicollinearity Analysis
                             Variables                               Collinearity Statistic

                                                          Tolerance                       VIF

                   Brand Awareness                          4.276                        1.397

                   Perceived Quality                        0.443                        1.005

                   Perceived Value                          5.810                        1.394

                  a. Dependent Variable: Purchase Intention


                                                                                                                472
   488   489   490   491   492   493   494   495   496   497   498