
Page 492 - MARSIUM'21 COMP OF PAPER
P. 492
Muhammad Amirul Asraf Bin Sungip (2022)
Recruitment 24 22.2
Executive 14 13
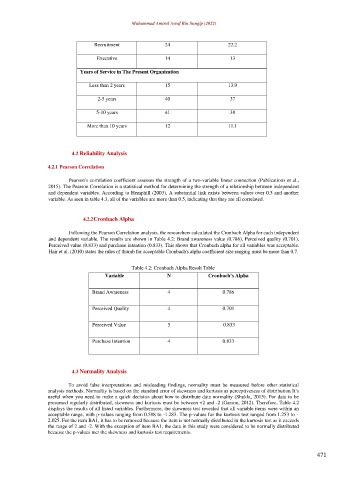
Years of Service in The Present Organization
Less than 2 years 15 13.9
2-5 years 40 37
5-10 years 41 38
More than 10 years 12 11.1
4.2 Reliability Analysis
4.2.1 Pearson Correlation
Pearson's correlation coefficient assesses the strength of a two-variable linear connection (Publications et al.,
2015). The Pearson Correlation is a statistical method for determining the strength of a relationship between independent
and dependent variables. According to Hemphill (2003), A substantial link exists between values over 0.5 and another
variable. As seen in table 4.3, all of the variables are more than 0.5, indicating that they are all correlated.
4.2.2 Cronbach Alpha
Following the Pearson Correlation analysis, the researchers calculated the Cronbach Alpha for each independent
and dependent variable. The results are shown in Table 4.2: Brand awareness value (0.786), Perceived quality (0.701),
Perceived value (0.833) and purchase intention (0.833). This shows that Cronbach alpha for all variables was acceptable.
Hair et al. (2010) states the rules of thumb for acceptable Cronbach's alpha coefficient size ranging must be more than 0.7.
Table 4.2: Cronbach Alpha Result Table
Variable N Cronbach’s Alpha
Brand Awareness 4 0.786
Perceived Quality 4 0.701
Perceived Value 5 0.833
Purchase Intention 4 0.833
4.3 Normality Analysis
To avoid false interpretations and misleading findings, normality must be measured before other statistical
analysis methods. Normality is based on the standard error of skewness and kurtosis as perceptiveness of distribution It’s
useful when you need to make a quick decision about how to distribute data normality (Shukla, 2015). For data to be
presumed regularly distributed, skewness and kurtosis must be between +2 and -2 (Garson, 2012). Therefore, Table 4.2
displays the results of all listed variables. Furthermore, the skewness test revealed that all variable items were within an
acceptable range, with p-values ranging from 0.588 to -1.283. The p-values for the kurtosis test ranged from 1.253 to -
2.025. For the item BA1, it has to be removed because the item is not normally distributed in the kurtosis test as it exceeds
the range of 2 and -2. With the exception of item BA1, the data in this study were considered to be normally distributed
because the p-values met the skewness and kurtosis test requirements.
471