
Page 494 - MARSIUM'21 COMP OF PAPER
P. 494
Muhammad Amirul Asraf Bin Sungip (2022)
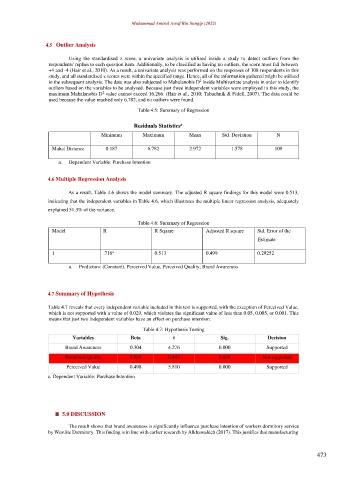
4.5 Outlier Analysis
Using the standardised z score, a univariate analysis is utilised inside a study to detect outliers from the
respondents' replies to each question item. Additionally, to be classified as having no outliers, the score must fall between
+4 and -4 (Hair et al., 2010). As a result, a univariate analysis was performed on the responses of 108 respondents in this
study, and all standardised z scores were within the specified range. Hence, all of the information gathered might be utilised
2
in the subsequent analysis. The data was also subjected to Mahalanobis D inside Multivariate analysis in order to identify
outliers based on the variables to be analysed. Because just three independent variables were employed in this study, the
2
maximum Mahalanobis D value cannot exceed 16.266. (Hair et al., 2010; Tabachnik & Fidell, 2007). The data could be
used because the value reached only 6.782, and no outliers were found.
Table 4.5: Summary of Regression
a
Residuals Statistics
Minimum Maximum Mean Std. Deviation N
Mahal Distance 0.187 6.782 2.972 1.578 108
a. Dependent Variable: Purchase Intention
4.6 Multiple Regression Analysis
As a result, Table 4.6 shows the model summary. The adjusted R square findings for this model were 0.513,
indicating that the independent variables in Table 4.6, which illustrates the multiple linear regression analysis, adequately
explained 51.3% of the variance.
Table 4.6: Summary of Regression
Model R R Square Adjusted R square Std. Error of the
Estimate
a
1 .716 0.513 0.499 0.29252
a. Predictors: (Constant), Perceived Value, Perceived Quality, Brand Awareness
4.7 Summary of Hypothesis
Table 4.7 reveals that every independent variable included in this test is supported, with the exception of Perceived Value,
which is not supported with a value of 0.029, which violates the significant value of less than 0.05, 0.005, or 0.001. This
means that just two independent variables have an effect on purchase intention.
Table 4.7: Hypothesis Testing
Variables Beta t Sig. Decision
Brand Awareness 0.304 4.276 0.000 Supported
Perceived Quality 0.029 0.443 0.658 Not supported
Perceived Value 0.498 5.810 0.000 Supported
a. Dependent Variable: Purchase Intention
■ 5.0 DISCUSSION
The result shows that brand awareness is significantly influence purchase intention of workers dormitory service
by Westlite Dormitory. This finding is in line with earlier research by Alkhawaldeh (2017). This justifies that manufacturing
473